National Blood Authority Australia
Annual Report 2010–11
Part 3: Performance: Securing The Supply Of Blood And Blood Products
The Annual National Supply Plan And Budget (NSP&B)
A key element of the NBA's role in ensuring security of supply is to develop, coordinate and monitor the annual NSP&B, including obtaining annual approval from health ministers.
This is achieved by:
- developing a national estimate of product demand
- liaising with jurisdictions and stakeholders to refine the estimated demand for products
- collecting and distributing data on product issued and reporting variations to jurisdictions on the approved supply plan
- intensively managing products if they are in short supply.
Performance against the 2011-12 NSP&B
Throughout 2011-12, demand was met by products supplied under the national supply plan, and supply risks were effectively managed. Lists of products supplied under contract during the year are contained in Appendix 5: Fresh blood components and Appendix 6: Plasma and recombinant products.
The approved budget for 2011-12 covering the supply and management of blood and blood products and services under contract was $1,035.5 million, comprising $548.0 million for fresh blood products and plasma collection and $473.2 million for plasma and recombinant products. The remaining $14.3 million included items such as contributions for the National Managed Fund, interest monies, support for the Australian Haemophilia Centre Directors' Organisation and administration of the ABDR.
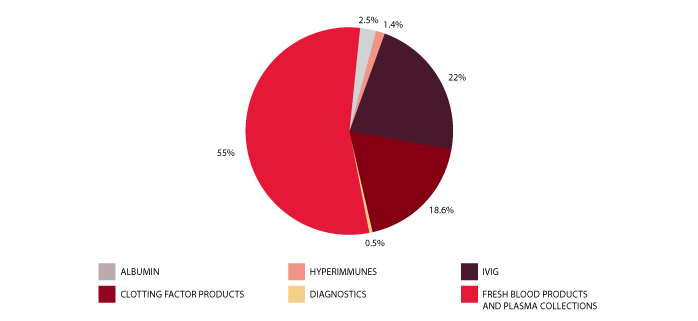
The list of products purchased from suppliers to meet this demand is provided in Table 3.1. Figure 3.1 identifies actual expenditure in each product category.
| SUPPLIER | PRODUCTS PURCHASED | 2008-09 ($M) | 2009-10 ($M) | 2010-11 ($M) | 2011-12 ($M) |
|---|---|---|---|---|---|
| CSL Limited | Plasma Products
Diagnostic Reagent Products
Imported Plasma and Recombinant
Management of National Reserve |
162.09 | 186.16 | 215.15 | 228.22 |
| Australian Red Cross Blood Service | Fresh Blood Products
|
432.62 | 456.12 | 496.57 | 526.35 |
| Baxter Healthcare Pty Ltd | Imported Plasma and Recombinant Products
|
84.09 | 90.62 | 96.93 | 45.95 |
| Bayer Australia | Limited Imported Plasma and Recombinant Products
|
18.67 | |||
| Pfizer Australia Pty Ltd | Imported Plasma and Recombinant Products
|
48.65 | 48.94 | 57.03 | 66.55 |
| Novo Nordisk Pharmaceuticals | Imported Plasma and Recombinant Products
|
17.40 | 26.42 | 27.37 | 24.55 |
| Octapharma Pty Ltd | Imported Plasma and Recombinant Products
|
46.90 | 48.69x | 8.95 | 23.38 |
| Lateral Grifols | Imported Plasma and Recombinant Products
|
0.00 | 0.00 | 24.50 | 22.51 |
| Grifols Australia (DiaMed Australia Pty Ltd) | Diagnostic Reagent Products
|
0.92 | 0.81 | 0.60 | 0.00 |
| Ortho-Clinical Diagnostics (Johnson & Johnson Company) | Diagnostic Reagent Products
|
0.47 | 0.43 | 0.38 | 0.45 |
| Bio-Rad Laboratories Pty Ltd | Diagnostic Reagent Products
|
0.00 | 0.00 | 0.00 | 0.13 |
| Abacus ALS Pty Ltd | Diagnostic Reagent Products
|
0.04 | 0.04 | 0.03 | 0.05 |
| TOTAL PURCHASES OF BLOOD AND BLOOD PRODUCTS | 793.18 | 858.23 | 927.51 | 956.81 | |
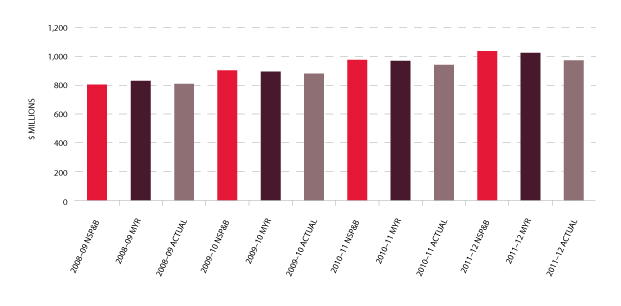
The total cost of products issued to all jurisdictions in 2011-12 amounted to $971 million (including product issued from stock). This represented an increase of $23.6 million (2.5 per cent) compared with 2010-11 which is well below the previous year's increase of $59.6 million (6.8 per cent). Figure 3.2 indicates a reduction in issues of product against the plan for some imported, red cell and platelet products and an apparent stabilising of demand for Factor VIII (FVIII). In addition, there were significant savings against the 2011-12 approved budget as a result of the successful tender processes for the supply of recombinant Factor VIII (rFVIII) and other imported products including IVIg, delivering a $33.7 million saving for governments for 2011-12. These arrangements are in place until July 2014 and will return further savings.
Fresh blood
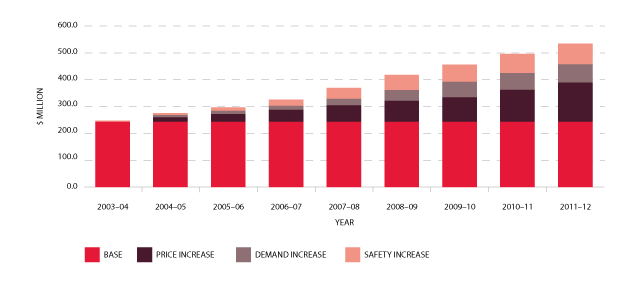
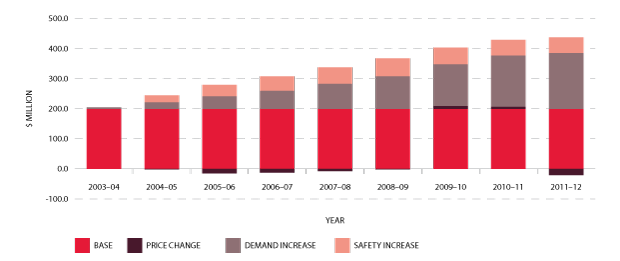
In the nine years to 2011-12, expenditure on fresh blood and plasma collections has increased from $247.8 million to $526.3 million. Of this, $145 million is due to price increases averaging 7.5 per cent per year. These price increases include major additional operational costs and investment in principal sites such as the Sydney and Melbourne processing centres. Demand for fresh products-principally red cells, platelets and plasma for fractionation-has been increasing at 3.5 per cent a year, resulting in additional expenditure of $68.7 million. A further $69.2 million is a consequence of the introduction of government-approved quality and safety measures such as the universal leucodepletion of platelets and red cells. These safety measures have resulted in an additional increase in expenditure averaging 3.6 per cent a year. The combined effect of these measures on expenditure can be seen in Figure 3.3.
The actual supply of fresh blood products for 2011-12 compared with the annual supply estimates agreed by the SCoH is set out in Table 3.2.
| Volumes | Units in NSP&B | Issues | Unit Variation on Plan |
% Variation on plan |
|---|---|---|---|---|
| Total red cells | 819,408 | 801,295 | -18,113 | -2.2% |
| Total platelets | 143,422 | 134,149 | -9,273 | -6.5% |
| Total clinical FFP | 166,747 | 159,024x | -7,723 | -4.6% |
| Total cryoprecipitate | 76,728 | 78,099 | 1,371 | 1.8% |
| Total cryodepleted plasma | 13,332 | 13,756 | 424 | 3.2% |
| Plasma for fractionation (in kgs) | 510,000 | 502,181 | -7,819 | -1.5% |
Issues of red cells
Red cells comprise 29 per cent of total blood and blood product expenditure and are the largest single item of cost in fresh products. Figure 3.4 indicates that the volume of red cells issued in 2011-12 was two per cent less than the volumes estimated in the NSP&B and demonstrated very little growth (0.1 per cent) from 2010-11. The gradual decrease in the rate of growth in volume of product per 1000 head of population being observed appears (see Figure 3.5) to reflect the outcomes of policies driving appropriate use and improved inventory management.
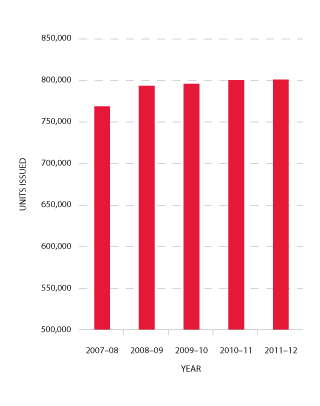
FIGURE 3.4 Red cells issued by the Blood Service, 2007-08 to 2011-12
|
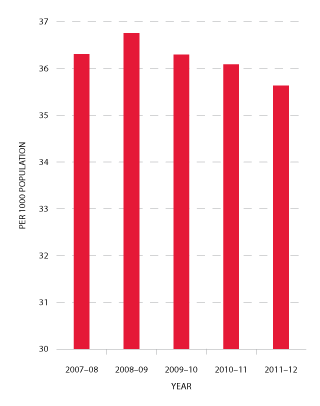
FIGURE 3.5 Red cells issued per 1000 head of population, 2007-08 to 2011-12
|
Issues of platelets
As is shown in Figure 3.6, the number of platelets issued in 2011-12 decreased slightly (-0.4 per cent) compared to 2010-11. This is the first time that a decline in the usage of platelets has been experienced. The pattern across the jurisdictions was different with declining or stable use in all states except for Queensland and Western Australia.
Issues of platelets per 1000 population decreased by 1.8 per cent in 2011-12 compared with a 3.6 per cent increase the previous year (see Figure 3.7).
While the actual issue of platelets in 2011-12 was lower than the NSP&B, the mix between whole blood pooled platelets and apheresis platelets was close to the NSP&B ratio. The 2011-12 NSP&B ratio was 61 per cent whole blood pooled and 39 per cent apheresis. The actual issue of platelets for 2011-12 was 60 per cent whole blood pooled and 40 per cent apheresis.
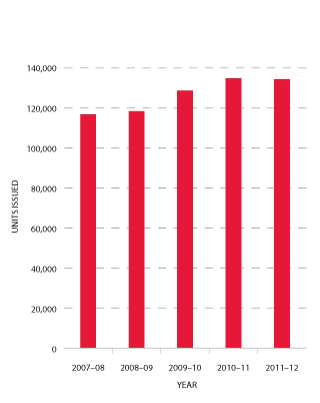
FIGURE 3.6 Platelets issued by the Blood Service, 2007-08 to 2011-12
|
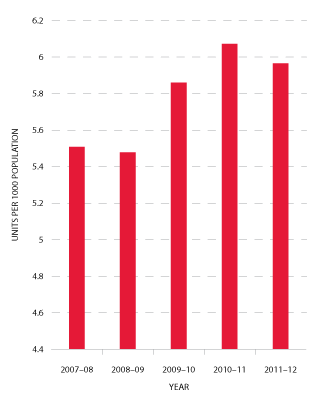
FIGURE 3.7 Platelets issued per 1000 head of population, 2007-08 to 2011-12
|
Issues of other fresh products
Demand for clinical FFP was marginally less than in the 2010-11 period and was five per cent lower than the estimate in the 2011-12 supply plan. The forecast growth for future years is based on population growth.
Cryoprecipitate in 2011-12 experienced an 11.4 per cent increase in demand over the previous year and was two per cent higher than the NSP&B. It remains difficult to predict demand for this blood component, as the number of patients treated with cryoprecipitate is small, but the volumes administered can be large.
Jurisdictions noted that cryoprecipitate is increasingly used in the treatment of massive bleeding and that this may drive an increase in demand in the coming years. Of note is that there is increasing interest in the use of fibrinogen concentrates as an alternate to cryoprecipitate, especially in emergency and remote settings.
Cryodepleted plasma demand decreased by 0.9 per cent in 2011–12 compared with 2010–11 and was 3.2 per cent above the NSP&B. It is difficult to forecast demand for cryodepleted plasma as this product is used spasmodically and episodically in very small numbers of patients.
Details of various aspects of the NBA's contractual arrangements with the Blood Service in 2011-12 are provided at pages 40-45.
Plasma and recombinant products
Products issued on plasma-derived and recombinant blood products decreased to $414.7 million in 2011-12, a decrease of $14.1 million (3.3 per cent) from 2010-11. As indicated in Figure 3.8, by far the largest proportion of this decrease was due to the reduced product prices, notably for rFVIII and imported IVIg, as discussed above. The impact of price decreases was significant, contributing 21.2 per cent to the total decrease in expenditure.
Details of supply management for plasma-derived and recombinant products are provided in pages 48-55.
Issues of clotting factors
Figures 3.9 and 3.10 indicate that the demand for Factor VIII products in 2011-12 was one per cent less than in 2010-11. The annual growth rates for this product since 2009-10 have been 2.1 per cent, 11.3 per cent and -1 per cent respectively. The demand for plasma-derived product has decreased significantly, from 33.2 per cent growth in 2010-11 to a -6.3 per cent reduction in demand in this reporting year. Demand for rFVIII has also decreased in 2011-12 resulting in a reduction in growth from 8.6 per cent in 2010-11 to -0.3 per cent for 2011-12.
The reduction in growth for Factor VIII may be attributed to a number of factors, including a reduction in the number of patients undergoing tolerisation2, a number of high volume patients participating in clinical trials and the continuing number of patients stabilising onto prophylaxis home treatment.
Figure 3.11 shows the market share of recombinant Factor VIII products purchased by the NBA over the past five years.
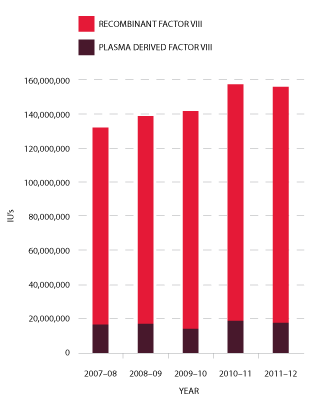
FIGURE 3.9 Issues of Factor VIII products, 2007-08 to 2011-12
|
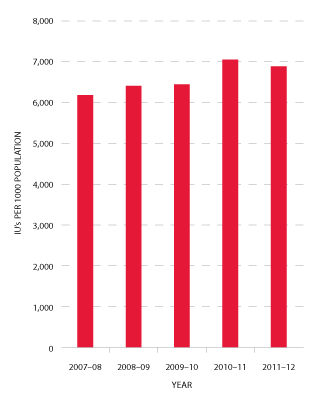
FIGURE 3.10 Issues of total Factor VIII per 1000 head of population, 2007-08 to 2011-12
|
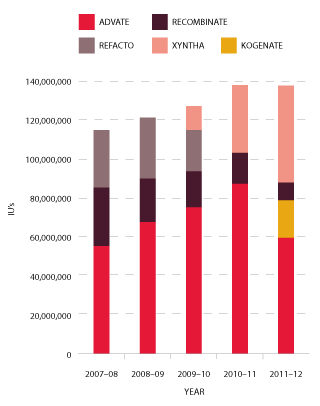
FIGURE 3.11 Market share of recombinant Factor VIII issues, 2007-08 to 2011-12
|
Demand for Factor IX (FIX) products in 2011-12 reduced by 4.4 per cent compared to 2010-11. This reduction was consistent with discussions during planning consultations with jurisdictions (see Figures 3.12 and 3.13).
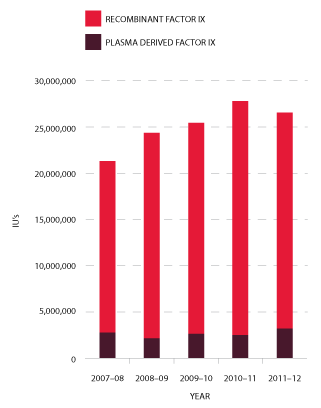
FIGURE 3.12 Issues of Factor IX products, 2007-08 to 2011-12
|
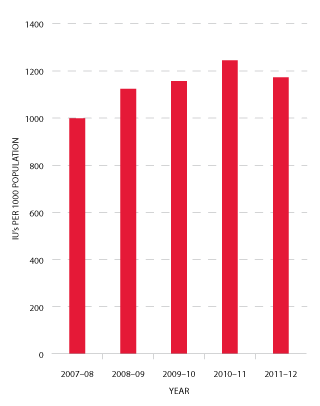
FIGURE 3.13 Issues of Factor IX products per 1000 head of population, 2007-08 to 2011-12
|
Jurisdictions acknowledge that a very small number of patients experiencing very high needs may considerably affect overall demand for recombinant Factor VIIa (rFVIIa) (see Figure 3.14) and Factor Eight Inhibitor Bypass Agent (FEIBA) (see Figure 3.15). The 2011-12 level of demand for rFVIIa was seven per cent below plan and 16 per cent below 2010-11. This trend is expected to continue, although at slightly lower rates of decrease, for the foreseeable future. FEIBA has seen a significant reduction in growth which has resulted in 2011-12 demand being 28 per cent less than in the NSP&B, and 3.2 per cent less than 2010-11. The driver behind this reduction is patient-specific with some high volume patients having now completed tolerisation.
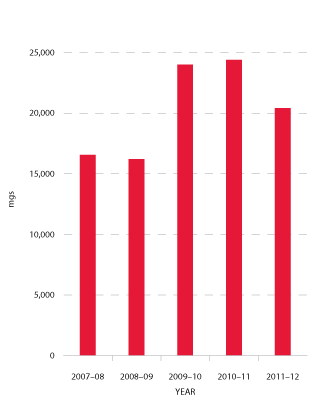
FIGURE 3.14 Issues of recombinant Factor VIIa, 2007-08 to 2011-12
|
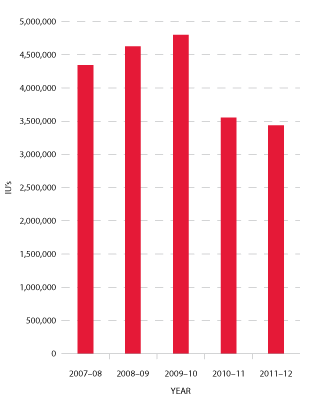
FIGURE 3.15 Issues of FEIBA, 2007-08 to 2011-12
|
Issues of immunoglobulin: IVIg and NIg
Figure 3.16 indicates that growth in demand for IVIg has continued at a relatively constant rate since 2007-08. The average annual growth from 2008-09 to 2011-12 is 11 per cent per annum.
In 2011-12, a total of 3.27 million grams of IVIg was issued, representing a cost of $204.4 million nationally (excluding the cost of plasma collections). Of this, 78 per cent was IVIg produced in Australia and 22 per cent was imported. Excluding IVIg issued under direct orders, a total of 12,130 (compared with 11,438 in 2010-11) patients nationally were issued IVIg during 101,388 treatment episodes (93,893 in 2010-11)3. Figure 3.17 shows comparative data on the issues of IVIg per 1000 head of population over the past five years.
Assessment of the proposed changes to the Criteria for the clinical use of IVIg in Australia, as detailed in the public consultation version, would indicate no new major driver for substantial growth.
The NBA produced an annual report of IVIg usage in 2010-11, in order to document the trends in the use of IVIg and provide insights into the drivers of use at the micro level. It draws on records of issues and purchases data held by the NBA, and application of IVIg to clinical indications from the Blood Service's supply tracking analysis recording system database. The report shows that there are still considerable variations in the grams issued per treatment episode across the jurisdictions for some conditions. Neurology remains the discipline using the greatest amount of IVIg and demand is still increasing. Haematology is the next largest but growth has slowed within this discipline, while growth has also declined in immunology, the third largest user of IVIg.
The report can be found on the NBA website at http://www.nba.gov.au/ivig/index.html.
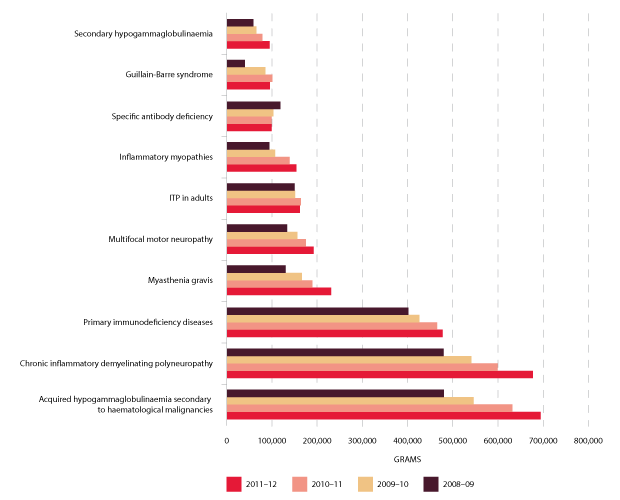
The top ten indications for which IVIg is issued most frequently are shown in Figure 3.18 below. They constitute 88 per cent of total use of IVIg in 2011-12 and represent the use by disease groups of over 90,000 grams nationally. The top three uses, considerably higher than remaining indications, are acquired hypogammaglobulinaemia secondary to haematological malignancies, chronic inflammatory demyelinating polyneuropathy and primary immunodeficiency diseases.
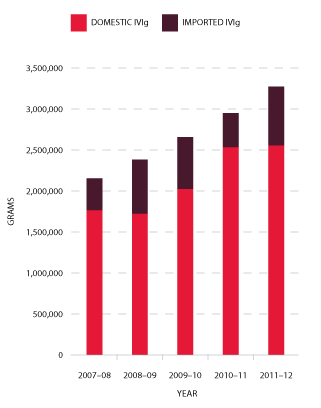
FIGURE 3.16 Issues of IVIg products, 2007-08 to 2011-12
|
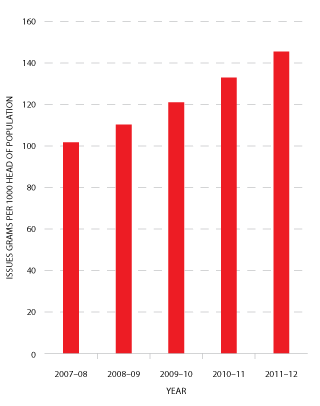
FIGURE 3.17 Issues of IVIg (grams) per 1000 head of population, 2007-08 to 2011-12
|
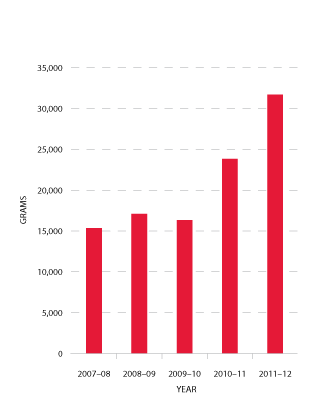
In 2011-12 there was a substantial and unforecasted increase in demand for normal immunoglobulin (NIg). CSL Limited produces NIg from hyperimmune plasma specially collected by the Blood Service (see Figure 3.19). The volume of product is limited by the availability of this specialised plasma, and by production scheduling arrangements in CSL Limited's manufacturing facility. The TGA has approved the use of NIg for intramuscular injection in the management of hypogammaglobulinaemia and for public health purposes to treat susceptible contacts of hepatitis A, measles and poliomyelitis.
The NBA and jurisdictions investigated the reasons for the unexpected increase in demand for NIg, which varies across the states and territories. It is likely that a significant proportion of the usage is off-label (that is, outside specific TGA approval) for subcutaneous administration, particularly for primary immune deficiency patients and in part as a result of a structured home treatment program.
This raised policy issues around inappropriate use of product and potentially reduced access for urgent public health disease control. However, the JBC determined after consultation that during 2011-12 and for 2012-13 the supply of product was sufficient, and that it was the responsibility of each jurisdiction to manage demand if necessary, rather than establishing a national policy or management framework.
See also page 76 which describes the current review commissioned by the CTEPC of the clinical governance and authorisation arrangements for IVIg, and potential alternatives.
Preparation of the 2012-13 NSP&B
The NBA works intensively with jurisdictions and suppliers to estimate demand and supply for products for the following year, negotiate prices, and obtain endorsement of the plan from health ministers. This process commences in September with discussions with jurisdictions and suppliers and is completed when the Federal Budget is handed down in May.
2012-13 demand for most blood and blood products is estimated to be higher than for 2011-12, although this does not translate into increased expenditure for all products. This is because the NBA has negotiated very competitive prices in its new contracts with suppliers of plasma-derived and recombinant blood products.
The approved 2012-13 NSP&B will also contain operating funds for the NBA to undertake a range of activities aimed at improving the clinical usage of blood and blood products, including:
- improving the sustainability and performance of the sector through enhanced data capture and the expert analysis of this data
- raising awareness of governments' stewardship expectations of users of blood and blood products, and their management of these products, through the development and publication of evidence-based national guidelines, in close collaboration with clinicians.
2 Tolerisation is a treatment regimen which aims to reduce or eliminate inhibitors (i.e. antibodies) to transfused clotting factors, e.g. FVIII.
3 201011 figures differ slightly from those published in last years annual report due to subsequent reconciliation