National Blood Authority Australia
Annual Report 2010–11
Part 3: Performance: Securing The Supply Of Blood And Blood Products
Managing Blood Supply Contracts And Arrangements
Maintaining security of supply also requires the NBA to manage contracts with suppliers of blood and blood products.
In 2011-12 the NBA managed 18 blood and blood product supply contracts and arrangements. The Deed with the Australian Red Cross Society was extended, and two new contracts were executed for the supply of imported intravenous immunoglobulin (IVIg) with Octapharma Australia Pty Ltd (Octagam) and Baxter Healthcare Pty Limited (Kiovig) and commenced on 1 January 2012.
Contract management activities included management of:
- Australia's fresh blood component requirements through the Deed of Agreement with the Australian Red Cross Society (the Red Cross)
- Australia's plasma product and recombinant product requirements through:
- the CSL Australian Fractionation Agreement (CAFA)
- contracts for the provision of imported IVIg, imported recombinant factors VIIa, VIII, IX, and XIII, and other imported plasma and recombinant products
- requirements for red cell diagnostic reagent products.
Management of fresh blood supply arrangements
The NBA manages the relationship with the Blood Service-the sole supplier of fresh blood components in Australia-and is responsible for negotiating and managing the Deed of Agreement with the Red Cross. The NBA also manages a number of projects involving the Blood Service and provides secretariat and project management support for the National Indemnity Reference Group which oversees the National Managed Fund.
The CEOs and chief financial officers of the two organisations meet every quarter, each CEO and Board Chair attends one meeting of the other organisation during the year and the two boards meet annually in October. In addition, the Blood Service reports annually to the SCoH against the ministerially-approved Statement of Expectations.
Blood Service: expenditure and product mix
Actual expenditure to the Blood Service increased from $496.6 million in 2010-11 to $526.3 million in 2011-12 (see Table 3.3). A list of the fresh blood components supplied under contract by the Blood Service is given in Appendix 5.
| YEAR | AMOUNT ($M) | % GROWTH |
|---|---|---|
| 2003-04 | 247.8 | |
| 2004-05 | 277.0 | 11.8 |
| 2005-06 | 297.7 | 7.5 |
| 2006-07 | 327.1 | 9.9 |
| 2007-08 | 369.1 | 12.8 |
| 2008-09 | 417.2 | 13 |
| 2009-10 | 456.1 | 9.3 |
| 2010-11 | 496.6 | 8.9 |
| 2011-12 | 526.3 | 6 |
| Total | 3414.9 | 9.9 (average) |
In 2011-12 the Blood Service achieved an operating surplus of $6.2 million through continued implementation of efficiencies measures.
Blood Service: supply performance
Supply performance measures require the Blood Service to manage donations and to process the products received from these donations in an efficient and targeted manner. Governments require the Blood Service to continually improve its performance in both areas.
The Blood Service continued to perform against all of the key performance indicators specified in the Deed. Some indicators of particular interest this year are summarised in Table 3.4. In addition, the Blood Service performance was assessed against the health ministers' 2010-11 to 2012-13 Statement of Expectations for the Australian Red Cross Blood Service. A key performance target for the Blood Service was to improve efficiency of conversion of whole blood collections to supply by one per cent each year during 2010-13. For 2010-11 the Blood Service achieved 80.2 per cent against a target of 79.1 per cent and for 2011-12 they achieved 85 per cent against a target of 80.1 per cent.
| Domain | Indicator | Annual result 2010-11 | Planning parameter |
Annual result 2011-12 |
|---|---|---|---|---|
| Donor management | Size of donor base: Whole blood Apheresis plasma Apheresis platelet |
515,959 71,919 11,598 |
518,700 74,900 12,900 |
504,600 84,400 11,900 |
| Frequency of donation (per year): Apheresis plasma |
4.34 |
4.73 |
4.24 |
|
| Supply chain management | Efficiency of collection (conversion to supply) Whole blood Order fulfillment* |
80.2% 85.3% |
81.2% 95% |
85% 89.5% |
| Quality and level of service | Overall approved health provider satisfaction with Blood Service | 84% | 48% | 52%** |
** There was a change in the measurement from 2010–11 to 2011–12, and therefore comparison across the years is not possible.
The target for the quantity of plasma for fractionation collected and supplied to CSL by the Blood Service for 2011-12 was 510 tonnes. Late in 2011-12, the Blood Service advised the NBA that it would be unable to achieve the target of 510 tonnes, but suggesting that it would achieve 500 tonnes. The result at the end of 2011-12 was that the Blood Service supplied 502 tonnes of plasma to CSL, eight tonnes below target. The reasons for this variance were:
- improved efficiency of conversion of whole blood collections to supply
- reduction in the rate of growth of demand for red blood cells.
Table 3.5 sets out the plasma volumes collected by the Blood Service over the past nine years.
| 2003-04 | 2004-05 | 2005-06 | 2006-07 | 2007-08 | 2008-09 | 2009-10 | 2010-11 | 2011-12 |
|---|---|---|---|---|---|---|---|---|
| 294.5 | 308.1 | 308.4 | 329.3 | 352.8 | 390.7 | 452.4 | 472.3 | 502.2 |
The NBA continues to work with the Blood Service to obtain a commitment to a three-year timeframe for planning the volume of plasma for fractionation to be collected. The project will seek to optimise cost-effectiveness while at the same time maintaining donor welfare and also immunoglobulin yields (see also page 46-50 on CSL performance).
Deed of Agreement
Negotiations for a new deed of agreement with the Red Cross commenced with the Blood Service in 2010. The 2006-09 Deed has been extended by mutual agreement of the parties until 30 June 2013. Finalisation of the new deed will be informed by the current review of the National Managed Fund (NMF) (see page 44), which is due to be completed in 2014. It is likely a further extension of the current Deed will be necessary to allow for finalisation of the NMF review.
During the year, the Blood Service and the NBA continued to work on operational requirements to prepare for the new deed, or for variations to the current Deed, including the following projects described further below:
- funding and services arrangement
- national service requirements and standards
- the output based funding model
- substitution and payment rules
- a research and development framework.
Funding and Services Agreement
The three-year Funding and Services Agreement and associated operational arrangements will be informed by the Statement of Expectations for the Australian Red Cross Blood Service. The statement sets out overarching principles and goals and contains a set of management and accountability principles addressing the core priorities of governments for improved efficiency. The Funding and Services Agreement will describe the arrangements for operational aspects of the deed framework.
National service requirements and standards
The national service requirements and standards will set out the Blood Service's relationships with health providers and the NBA. They include business rules and standards for ordering, delivery, and acceptance of products and will guide the Blood Service in developing consistent service level agreements with approved health providers.
Output based funding model
The objectives of the output based funding model are to cost products and services on the basis of actual costs of production and to pay only the costs of services actually provided. The model defines all of the products and services to be delivered under the contractual arrangements, product prices determined by agreed cost attribution rules, cash flows, product cost indexation and risk management arrangements. The model was implemented in July 2010 and the Blood Service has generated significant operational efficiencies.
The model is operating from 2010-11 to 2012-13, and negotiations for the next cycle, to start on 1 July 2013, commenced in February 2012.
Substitution and payment rules
specific products may be supplied, and the payment processes relating to receipt of products that will apply. During the year the NBA held two workshops to draft the rules, with participants from the JBC, laboratory staff from three jurisdictions and the Blood Service. Work continues on a range of operational and system issues to finalise and implement the new rules.
National research and development framework
In 2011-12 the Blood Service received grant funding of approximately $7.8 million for its research and development program, primarily through the Deed of Agreement. There are four research programs:
- donor and community research
- applied and developmental research
- transfusion science research
- clinical research.
The NBA and the Blood Service are working to finalise a research and development framework, which will outline the strategy to ensure appropriate incorporation of government priorities and expectations in the development and implementation of the Blood Service research program. It also describes reporting requirements that will improve the transparency to governments of activities and expenditure of the research and development program. The agreed principles and processes of the research and development framework will be refl?ected in the new deed.
National inventory management framework
Work commenced on developing a nationally consistent inventory management framework covering blood products funded by governments and manufactured by the Blood Service, in particular red blood cells. The aim is to have a comprehensive, efficient and effective guideline for better practice inventory management and product safety stock levels. This will ensure that blood products are available to meet clinical demand when they are needed, improve financial performance and reduce the amount of product that is discarded. In addition, the framework will identify stakeholder responsibilities throughout the blood supply chain and the linkages between them.
During 2011-12 a project team was established that includes representatives from the NBA and the Blood Service and a project manager was recruited for the NBA (see pages 106-107).
The graph in Figure 3.20 shows the trend for total red blood cell inventory levels for 2010-11 and 2011-12, held by both approved health providers and the Blood Service. There continues to be a seasonal trend in the levels of inventory held. The levels of inventories in 2011-12 have been lower than the previous year. The changes for each quarter in red cell age at issue from the Blood Service to approved health providers, is shown in Table 3.6.
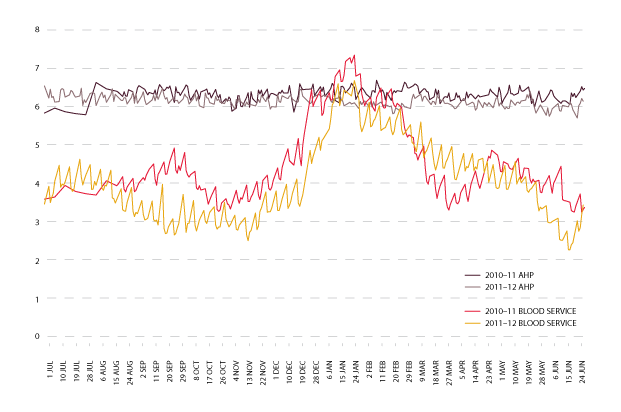
| Q1 | Q2 | Q3 | Q4 | |
|---|---|---|---|---|
| 2010-11 | 7.3 | 7.4 | 9.7 | 7.3 |
| 2011-12 | 6.6 | 6.2 | 9.3 | 7.3 |
Blood Service: Strategic capital investment plan
Under the Deed, the Blood Service receives an agreed capital budget, set at ten per cent of total operational funds provided. For 2011-12, expenditure was approximately $46.3 million. Payment of the capital is through the output based funding model and is included in the product pricing. Table 3.7 shows the value of the approved annual capital plans over the past five years.
| 2007-08 $ MILLION |
2008-09 $ MILLION |
2009-10 $ MILLION |
2010-11 $ MILLION |
2011-12 $ MILLION |
|---|---|---|---|---|
| 32.96 | 37.99 | 41.21 | 44.07 | 46.3 |
These funds are required to be managed through the strategic capital investment plan which, with the annual capital plan, is reviewed by the NBA each year. The plan details the capital expenditure that is expected to be required to sustain assets for the next three years. The 2012-15 plan includes investment for improvement initiatives and replacement of assets such as laboratory, administration and information and communication technologies (ICT) equipment. The plan is assessed using factors such as benchmarking of like industries and international peers, manufacturer warranties, availability of parts, internal expert advice and accounting standards.
Melbourne Processing Centre (formerly the Victoria and Tasmania principal site)
In December 2008, health ministers gave in-principle approval for additional funding for the Blood Service over 20 years to meet the costs of building and outfitting leases for a new principal blood manufacturing site in Melbourne.
The Hon Catherine King MP, Parliamentary Secretary for Health and Ageing formally opened the centre on 30 April 2012. The centre is responsible for the manufacture of blood for Victoria and Tasmania, comprising 26 per cent of the nation's blood supply (see page 45).
National Managed Fund (NMF)
The NMF was established to cover potential future claims made against the Blood Service in relation to the supply of blood and blood products in Australia. The memorandum of understanding for the management and administration of the NMF includes an expectation that the funds will earn interest to enable the real value of the annual contributions to the fund to be maintained over time and reduce the level of contributions by governments and the Blood Service. The fund was established as a discretionary managed fund with a finite scope and there is no contractual liability to agree to claims. During the year the NBA engaged KPMG to develop an investment strategy for the NMF.
The National Indemnity Reference Group (NIRG) is a technical advisory subcommittee of the JBC, providing expertise on matters such as policy, review and monitoring of the Blood Service risk management strategy. The NBA provides secretariat support to the NIRG, which meets twice a year.
PricewaterhouseCoopers advises the NIRG on core services, including incident analysis, horizon scanning, Blood Service risk management assessment and actuarial services. In presenting its annual actuarial and liability report for 2011 and estimates of the 2012-13 contributions to the NMF from governments, the company concluded that the risk of transfusion acquired diseases for the commonly known pathogens in Australia is now very small.
During 2011-12 PricewaterhouseCoopers also commenced a review and update of the claims manual and incident reporting processes, and presented bi-annual horizon scanning reports.
In 2010-11 the JBC endorsed a review of the scope and the discretionary nature of the NMF and a review of the statutory defence legislation (blood shield legislation) for ministers to consider. In August 2011 the SCoH endorsed an action plan to review:
- NMF's policy, legislative base, scope and discretionary nature
- harmonisation of the blood shield legislation4
- the Blood Service's commercial insurance coverage
- roles and responsibilities of the NIRG.
Consideration of these important issues will inform, and be informed by, ongoing negotiations for the new deed of agreement with the Red Cross. The complexity of the issues to be considered will require a multidisciplinary approach and extensive consultation with a wide range of experts. A JBC subcommittee was established to oversee the review, for which the NBA is providing secretariat services, with much of the technical work to be outsourced. The subcommittee is chaired by Mr Ken Barker, a long-standing member of the NBA Board.
A tender process commenced to procure expert services to undertake some of the activities outlined in the ministerially endorsed action plan. Work is expected to commence early in 2012-13.
World-class and quake-proof blood processing centre for Melbourne
A fresh injection of government funding allowed the Blood Service to open the largest blood processing facility in the southern hemisphere, converting a disused Melbourne car factory into a high-tech laboratory.
The Melbourne Processing Centre has been designed to assist Australians even in times of disaster, with its structure able to withstand a magnitude seven earthquake and to operate without water, gas, electricity or sewerage for four days.
The centre was opened on 30 April 2012 by the Parliamentary Secretary for Health and Ageing, The Hon Catherine King, who described it as 'world-class health infrastructure'. 'Australian governments have committed up to $213 million to the Blood Service to purchase, redevelop and fit-out this principal production and manufacturing site in Melbourne, and for ongoing costs over the next 20 years,' she said at the opening. This included $120 million from the Australian Government's Health and Hospitals Fund, with the remaining costs met by state and territory governments.
The Blood Service has five principal blood manufacturing facilities-located in Brisbane, Sydney, Melbourne, Adelaide and Perth-which receive blood from donor collection sites around Australia. The new Melbourne facility will process 26 per cent of the nation's blood supply, and all of Victoria's and Tasmania's blood, which amounts to about 1500 blood donations a day. All testing, processing, distribution, research and administration functions for the Blood Service in Victoria and Tasmania will be based at this facility.
An industrial area of inner Melbourne was chosen for the new site, but construction was delayed by necessary and extensive site remediation work. Despite these obstacles, construction and fit-out of the centre was completed on time and within budget. The TGA licenced the premises to operate in March 2012 and the Blood Service transitioned from their former principal processing site in Southbank to the new site in that month.
Management of plasma and recombinant supply arrangements
The NBA is responsible for negotiating and managing contracts and standing offers with commercial suppliers of blood and blood products. These contracts relate to the supply of locally produced plasma-derived products; imported plasma-derived and recombinant products and red cell diagnostic reagents.
In the interests of maintaining good relationships with our commercial suppliers, we have developed clear and transparent policies and reporting arrangements for our tendering processes. The NBA has also established a range of mechanisms to enhance our relationships with current and potential suppliers, including encouraging feedback. One important event is our annual Blood Product Suppliers Forum, which was held this year in April 2012 (see page 47).
Locally produced plasma-derived products: CSL Australian Fractionation Agreement
In Australia, CSL Limited fractionates plasma from donations collected by the Blood Service and supplies a range of immunoglobulin and hyperimmune products, clotting factors and albumin, for domestic use (see Appendix 6).
Plasma fractionation arrangements are currently governed by the CSL Australian Fractionation Agreement (CAFA) which took effect on 1 January 2010. The CAFA sets out CSL Limited's obligations regarding plasma stewardship, production, inventory management, product quality, pricing and payments, supply, reporting and performance and risk management.
The CAFA establishes an ongoing contract management dialogue between CSL Limited and the NBA through an annual cycle of management and executive meetings to discuss and monitor strategic and operational matters. In 2011-12, CSL Limited and the NBA held five contract management meetings, a regular annual risk management workshop in August 2011 and a workshop on a range of issues including minimum product inventory levels in June 2012. In addition, two update and planning meetings were held between the CEOs of the NBA and CSL Limited. Topics discussed between the CEOs included:
- trends and forecasts for products in Australia and globally
- CSL Limited's research and development program
- CSL Limited's investment in, and upgrading of, its Broadmeadows facility
- the recall of Albumex in March 2012
- management of the National CSL Reserve and the minimum product inventory
- domestic IVIg production
- potential new products.
During the year, three new versions of CSL Limited products provided under the CAFA were approved by the JBC for supply through the NSP&B commencing in 2011-12: Rh(D) immunoglobulin-625 IU and 250 IU-and Biostate 1000 IU.
Taking the pulse of blood product suppliers
Suppliers of blood products in Australia say the NBA is clear in the way it runs its contract tender process.
These findings stem from the most recent Blood Products Suppliers Forum, held at the National Portrait Gallery in April 2012, to promote face-to-face discussion with suppliers. All current and potential suppliers were invited to attend, as well as representatives of industry bodies and market consultants.
Prior to the forum, all invitees were sent an anonymous online survey asking them to rate the NBA's performance. The survey results, which were presented at the forum, revealed that 88 per cent of suppliers rated the NBA's tender process as satisfactory or better.
The Australian market for suppliers of blood products is very small. To encourage competition, the NBA stages the forum as a yearly event to hear from existing suppliers and encourage new entrants to the market. The NBA takes this approach to ensure prudent use of public funds, which supported the industry through expenditure of $426.1 million for plasma and recombinant products in 2011-12.
Changes were made to the format for the 2012 Suppliers' Forum, with many agenda items presented in a way that stimulated dialogue between the NBA and blood product suppliers. It was also an excellent opportunity for the NBA to inform suppliers of the current priorities and future plans of the NBA and encourage discussion on a number of key areas that will potentially affect suppliers. These included:
- possible future NBA directions, including the impact of health policy and reform
- new clinical practice guidelines of blood products
- development of a national data strategy for the blood sector
- priorities for contract management arising from recent tenders
- supplier developments in relation to barcoding/RFID technology
- possible linking of supplier systems to the NBA's online blood ordering and inventory management system BloodNet for future product ordering.
All presentations from the Suppliers Forum, including the results of the pre-forum and post-forum surveys, can be found on the NBA website at www.nba.gov.au/expert/suppliers.html.
Expenditure
Actual expenditure on CSL Limited products increased by $14.5 million in 2011-12, from $210.5 million in 2010-11 to $225 million in 2011-12 (see Table 3.8). This represents an increase of 6.9 per cent compared to an average annual increase of 6.2 per cent from 2003-04 to 2011-12.
| YEAR | AMOUNT ($M) | % GROWTH |
|---|---|---|
| 2003-04 | 141.2 | 0 |
| 2004-05 | 138.5 | -1.9 |
| 2005-06 | 133 | -3.9 |
| 2006-07 | 141.3 | 6.2 |
| 2007-08 | 155.9 | 10.3 |
| 10.3 | 158.1 | 1.4 |
| 2009-10 | 182.4 | 15.4 |
| 2010-11 | 210.5 | 15.4 |
| 2011-12 | 225.1 | 6.9 |
| Total | 1486 | 6.2 (average) |
Three products contributed to most of the volume-based increase in 2011-12:
- a 34.5 per cent increase in demand for NIg 5ml
- a 12.8 per cent increase in demand for prothrombin complex concentrate
- a 27 per cent increase in demand for plasma defined Factor IX.
Performance
By the end of June 2012 specification of some reporting requirements under the CAFA remained outstanding. The establishment and maintenance of a minimum starting plasma inventory had not commenced. The latter is subject to an analysis of risk by the NBA and further policy and cost endorsement from governments.
The process of measuring performance against the indicators provides incentive for high levels of performance by CSL Limited through the application of a balanced regime of payment consequences, including a payment incentive for IVIg yield and structured rebates on other key performance indicators for performance below agreed tolerance thresholds.
The suite of performance indicators in the CAFA is intended to highlight those areas of CSL Limited's performance that are of most significance to product recipients and governments. They cover:
- plasma stewardship-the amount of starting plasma funded by the NBA which is lost through the processes of manufacturing and distribution
- production yield-the annual average yield of IVIg production, with contractual incentives to achieve in excess of an annual average yield of 5.2 grams of IVIg per kilogram of starting plasma
- management of required inventory levels-maintenance of the required minimum inventory levels of starting plasma and finished products held either in CSL Limited inventory or the NBA-funded National CSL Reserve
- fulfilment of orders-fulfilment of orders on time, in full, to the right recipient and otherwise in accordance with the requirements of the CAFA
- shelf life of National CSL Reserve products-maintenance of required minimum shelf life for products held in the NBA-funded National CSL Reserve.
In 2011-12, CSL Limited generally performed well against the CAFA key performance indicators as shown in Table 3.9. Their performance was affected in March 2012 as a result of mandatory quarantine and recall of a number of batches of Albumex due to a manufacturing contamination (see page 80). This was assessed as a performance breach resulting in a financial penalty.
| Description of Performance Measure | ||||||
|---|---|---|---|---|---|---|
| Results 2011-12 | ||||||
| Q1 | Q2 | Q3 | Q4 | ANNUAL | ||
| KPI 1 | Plasma stewardship | Substantially Achieved | Substantially Achieved | Substantially Achieved | Substantially Achieved | Substantially Achieved |
| KPI 2 | Production yield | 5.00 g/kg | 5.01 g/kg | 5.11 g/kg | 5.22 g/kg | 5.11 g/kg |
| KPI 3 | Management of required inventory levels* Minimum Starting Plasma Inventory (Not active in 2011-12) |
|||||
| Products in CSL Inventory | 100% Achieved | 97% Achieved | 94% Achieved | 92% Achieved | 96% Achieved | |
| Products in National CSL Reserve | 100% Achieved | 98% Achieved | 91% Achieved | 89% Achieved | 95% Achieved | |
| KPI 4 | Fulfilment of orders | |||||
| Orders by Distributor (Blood Service) | 100% Achieved | 99% Achieved | 98% Achieved | 99% Achieved | 99% Achieved | |
| Orders by Non-Distributor | 100% Achieved | 99% Achieved | 97% Achieved | 97% Achieved | 98% Achieved | |
| KPI 5 | Shelf Life of National Reserve Products** | 92% Achieved | 98% Achieved | 100% Achieved | 94% Achieved | 96% Achieved |
** The NBA advised CSL that the shelf life of some hyperimmune products held in the National CSL Reserve would be reduced to avoid surplus production.
*** This table reports actual performance. There are a range of tolerances for each of the KPIs under the CAFA,
and CSL’s performance fell within these tolerances with few exceptions.
During the year CSL Limited requested changes to the CAFA arrangements and revisions to current agreed inventory levels:
- as a result of a significant drop in its immunoglobulin (IgG) yield due to factors related to the plasma collection program of the Blood Service. As a result of this reduction in yield, and other logistical factors, CSL Limited was unable to supply Intragam P 200ml from its working inventory against the full annual supply estimate amounts. From November 2011 the NBA worked with CSL Limited and the Blood Service to implement a revised monthly supply plan for this product. The NBA also gave approval for CSL Limited to access the Minimum Product Inventory and the National CSL Reserve to augment supply. This decision was taken on the basis that in the event of a national emergency the supply of IVIg could be maintained under the NBA's contracts for imported product; and that this course of action would be preferable to transferring patients onto alternative products. By the end of June 2012 CSL Limited had fully restocked the Minimum Product Inventory and the National CSL Reserve, although the NBA will continue to carefully manage the planned supply of Intragam P in 2012-13.
- as a result of a significant increase in demand for normal immunoglobulin (NIg). CSL Limited produces 2ml and 5ml vials of NIg from hyperimmune plasma collected by the Blood Service. The amount produced is limited by the availability of specialised plasma collected by the Blood Service and by production scheduling capacity in the CSL Limited manufacturing plant. Following a mid-year review of supply forecasts and consultations with CSL Limited and jurisdictions, the NBA determined that the Blood Service and CSL Limited had sufficient capacity to meet the increased demand.
- The NBA investigated the reasons for a sudden and unheralded increased demand in NIg, which varies between states and territories. NIg has registered indications for intramuscular injection for the management of some forms of primary hypogammaglobulinaemia, and for prophylactic treatment of susceptible contacts of hepatitis A, measles and poliomyelitis. The NBA found that NIg is increasingly being used off-label (i.e. outside TGA approval) for subcutaneous administration, particularly for primary immunodeficiency patients, in some areas as part of a structured subcutaneous immunoglobulin home treatment program. This raised a concern that NIg use may circumvent the established authorisation framework for the use of IVIg which is set down in the Criteria for the clinical use of intravenous immunoglobulin in Australia. As a result, jurisdictions agreed to consider specific state or territory actions to limit or manage inappropriate use of NIg, pending the outcomes of the national review of the clinical governance and authorisation framework for IVIg. During 2012-13 the NBA and jurisdictions will consider the policy implications of this new development (see also pages 76-77 describing this review, and page 56 on the evaluation of new product proposals).
A description of how the NBA and the blood sector managed a threat to CSL Limited's supply of albumin during the year is described on page 80 in the section which focuses on how the NBA manages risk.
Imported intravenous immunoglobulin
Imported intravenous immunoglobulin supplements domestic IVIg production to meet clinical demand in Australia. In addition to supply under the national blood arrangements, the NBA also supports the purchasing of small amounts of IVIg using jurisdictional direct orders.
Re-introduction of Octagam 5 per cent
The TGA approved the re-introduction of Octagam 5 per cent in October 2011 following the voluntary recall of product in September 2010, and we have observed good acceptance by clinicians. The NBA worked with the Blood Service, Octapharma Australia Pty Ltd and Grifols Australia Pty Ltd to manage the transition of patients from Flebogamma 5 per cent DIF under the national supply arrangements; this was achieved by March 2012.
New contract arrangements
In October 2011 the NBA signed contracts for the supply of imported IVIg, achieving all of the policy parameters endorsed by governments which are designed to improve security of supply, increase choice of product for clinicians and maintain competitive pressure on price and performance standards.
The contracts in place for supply of imported IVIg during 2011-12 were with:
- Octapharma Australia Pty Ltd for the supply of Octagam 5 per cent. The earlier contract had been extended in May 2010 to operate until 31 December 2011. A new contract took effect on 1 January 2012 for supply of Octagam 5 per cent. A 10 per cent formulation of this product became available in July 2012
- Baxter Healthcare Pty Ltd for the supply of Kiovig 10 per cent from 1 January 2012
- Grifols Australia Pty Ltd for a direct order contract operating until 31 December 2012 for the supply of Flebogamma 5 per cent DIF. Until March 2012 this product was also available under the national supply plan as a result of the Octagam recall. A new direct order contract for continued supply of Flebogamma 5 per cent commenced on 1 January 2012.
Under the national blood arrangements the Blood Service is responsible for the allocation of either domestic or imported IVIg in accordance with a plan. The plan is developed in consultation with IVIg user groups and jurisdictions and specifies the categories of patients to receive each type of product. In general, the plan seeks to allocate imported IVIg for shorter term conditions, and domestic IVIg for longer-term conditions, and to keep the allocation categories consistent between the states and territories.
Expenditure
The new supply arrangements generated savings to governments of $3.3 million in this financial year. In 2011-12, the NBA spent $52.7 million under these contracts, comprising $23.4 million for Octagam, $21.9 million for Flebogamma and $7.4 million for Kiovig.
Performance
The performances against key indicators of the suppliers of imported IVIg are set out in Table 3.10 overleaf.
| Results July-December 2011 (former contract with Octapharma) |
|||
|---|---|---|---|
| Performance measure | Q1 | Q2 | |
| KPI 1 | In-Country Reserve | Quarter 1 not applicable. Octapharma did not return to the market until October 2011 following the nationwide recall of Octagam in September 2010 | Fully achieved |
| KPI 2 | Shelf Life on products delivered to Approved Recipients | Fully achieved | |
| KPI 3 | Delivery Performance | Fully achieved | |
| KPI 4 | Ordering by Approved Recipients | Fully achieved | |
| KPI 5 | Reporting | Fully achieved | |
| KPI 6 | Record-keeping | Fully achieved | |
| Results JANUARY-JUNE 2012 (contract COMMENCED 1 JANUARY 2012) |
|||
|---|---|---|---|
| Performance measure | OCTAPHARMA | BAXTER HEALTHCARE | |
| KPI 1 | In-Country Reserve | Fully achieved | Fully achieved |
| KPI 2 | Shelf Life on products delivered to Approved Recipients | Fully achieved | Fully achieved |
| KPI 3 | Delivery Performance | Fully achieved | Partially achieved* |
| KPI 4 | Ordering by Approved Recipients | Fully achieved | Fully achieved |
| KPI 5 | Reporting | Fully achieved | Fully achieved |
| KPI 6 | Record-keeping | Fully achieved | Fully achieved |
Imported plasma-derived and recombinant blood products
The NBA has contracts with suppliers for the importation of selected plasma-derived and recombinant blood products to augment domestic supply in cases where these products are not produced in Australia or domestic production cannot meet demand.
Implementation of new contract arrangements
New three-year contracts for factors VII, XIII, recombinant factors VIII and IX, Protein C, activated prothrombin complex concentrate and anti-Rh(D) immunoglobulin took effect on 1 July 2011. In 2011-12 the NBA managed contracts for the supply of imported plasma-derived and recombinant blood products with five companies: Bayer Australia Ltd, Baxter Healthcare Pty Ltd, CSL Limited, Novo Nordisk Pharmaceuticals and Pfizer Australia Pty Ltd. The NBA spent $148.81 million under these contracts; expenditure on the supply of imported blood products since the establishment of the NBA is shown in Table 3.11.
TABLE 3.11 Annual expenditure on imported products (excluding IVIg) by company, 2003-04 to 2011-12
| YEAR | BAXTER | PFIZER | NOVO NORDISK | BAYER | CSL (IMPORTED) | |||||
|---|---|---|---|---|---|---|---|---|---|---|
| Amount ($M) | % Growth | Amount ($M) | % Growth | Amount ($M) | % Growth | Amount ($M) | % Growth | Amount ($M) | % Growth | |
| 2003-04 | $32.20 | - | $5.50 | - | $14.60 | - | - | - | - | - |
| 2004-05 | $54.50 | 69.4 | $10.90 | 96.5 | $18.80 | 28.6 | - | - | - | - |
| 2005-06 | $69.90 | 28.2 | $15.90 | 45.5 | $23.40 | 24.5 | - | - | - | - |
| 2006-07 | $71.50 | 2.3 | $33.80 | 45.5 | $26.90 | 15.3 | - | - | - | - |
| 2007-08 | $80.10 | 12.0 | $42.40 | 25.3 | $17.40 | -35.3 | - | - | - | - |
| 2008-09 | $84.10 | 5.0 | $48.60 | 14.8 | $17.40 | -0.2 | - | - | - | - |
| 2009-10 | $90.61 | 7.7 | $48.94 | 0.7 | $26.42 | 51.8 | - | - | - | - |
| 2010-11 | $96.93 | 7.0 | $57.03 | 16.5 | $27.37 | 3.6 | - | - | - | - |
| 2011-12 | $45.95 | 52.6 | $66.55 | 16.7 | $24.50 | 10.5 | $11.30 | - | $0.50 | - |
| TOTAL | $625.79 | 9.88 (avg.) | $329.62 | 32.69 (avg.) | $196.79 | 9.73 (avg.) | $11.30 | - | $0.50 | - |
The NBA worked with suppliers, the Australian Haemophilia Centre Directors' Organisation (AHCDO), Haemophilia Foundation of Australia (HFA), the Australian Haemophilia Nurses Group and the Blood Service to implement the new supply arrangements and encourage feedback on any side effects or other problems experienced by patients in transferring to the new products. Meetings were held with suppliers during the second half of 2011 to discuss in-country reserves, information about supply and demand, performance expectations and the management of the transitional arrangements for all of the new products. Early in 2012 consultations commenced in relation to the introduction of more comprehensive reporting arrangements aimed at producing higher quality data for monitoring inventory and delivery performance.
In particular, close monitoring throughout the year was required for rFVIII since about 75% of haemophilia A patients needed to be transferred to new products; supply of Advate and Recombinate ceased on 30 June 2012. Additional funding was provided to haemophilia treatment centres, through AHCDO, to meet the extra costs associated with the transition and to monitor any changes to adverse events arising from the change in products.
During the year the NBA also monitored the international debate on the incidence of inhibitor development in different kinds of rFVIII, following the publication of a meta-analysis of prospective clinical studies by Aledort et al5 and associated critical responses.
Performance
As in previous years, contracted suppliers performed well against contractual key performance indicators in 2011-12 (see Table 3.12).
| KPI | Performance Measure | Baxter | Bayer | CSL | Pfizer | Novo Nordisk |
|---|---|---|---|---|---|---|
| 1 | Supply security inventory holding-maintenance of in country reserve (ICR) | Fully achieved | Fully achieved | Subject to transitional arrangements* | Fully achieved | Fully achieved |
| 2 | Shelf life of products delivered to approved health providers (AHPs) | Fully achieved | Fully achieved | Fully achieved | Fully achieved | Fully achieved |
| 3 | Delivery Performance | Subject to transitional arrangements* | ||||
| 4 | Reporting accuracy and timeliness | |||||
Supply arrangements for rFVIIa
rFVIIa is used to treat haemophilia patients with inhibitors and patients with some other inherited bleeding disorders. Demand for the product is difficult to forecast as it can be highly variable. A small number of patients experiencing a high requirement can significantly increase overall demand.
Novo Nordisk is currently the sole manufacturer of rFVIIa globally and our contract with the company was extended in 2010 until 30 June 2012, with no possibility of a further extension. During the year the NBA reviewed the operation of the current contract and the performance of the company and consulted with stakeholders. In preliminary market research we also identified a number of alternative rFVIIa products which are in clinical development, but none are likely to be registered and available for supply in Australia until 2014
At its meeting in May 2012 the JBC endorsed the policy parameters to be negotiated with Novo Nordisk during the development of a new contract. This included performance and accountability improvements similar to those in other recent commercial contracts, achieving appropriate value for money and maintenance of governments' policy of supplying rFVIIa under the national blood arrangements for treatment of bleeding disorders. At the end of June 2012 the NBA finalised a two-year contract with Novo Nordisk to commence on 1 July 2012
Diagnostic reagent products
Diagnostic reagents are used in laboratory tests known as blood typing and cross matching. These tests ensure that a person needing a blood transfusion receives blood compatible with their own. Australian governments currently subsidise the purchase of in-vitro red cell diagnostic reagents by public laboratories and the Blood Service, through the National Blood Agreement.
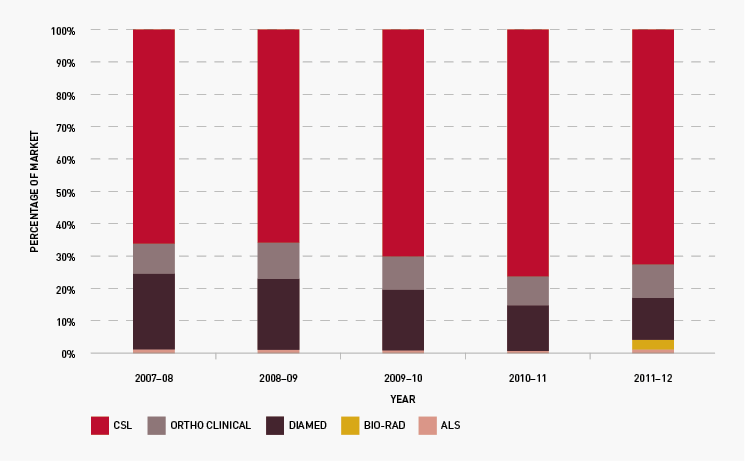
On 1 July 2011 five new three-year contracts took effect for the supply of red cell diagnostic reagents to public laboratories: with CSL Limited, Grifols Australia Pty Ltd (formerly trading as Diamed), Abacus ALS Pty Ltd, Johnson and Johnson Medical Pty Ltd (trading as Ortho-Clinical Diagnostics) and Bio-Rad Laboratories Pty Ltd. The range of reagent products has been expanded from 110 to 138 under the new arrangements, and laboratories are gradually adjusting their ordering patterns to the bigger range of products. We worked closely with suppliers to implement compliance and reporting on performance indicators.
Expenditure on diagnostic reagent supply is capped at $4.8 million per year. The NBA manages the cap for all jurisdictions and our five suppliers, a complex task necessitating extensive communication with state and territory representatives on allocation of products and management of the cap between suppliers and within jurisdictions. In collaboration with Queensland, the NBA commenced a review of current policies, arrangements and the efficiency of use of diagnostic reagents
Figure 3.21 shows that the total market share of each supplier has continued to remain relatively stable during the year
4 Blood shield laws protect health care providers from liability for transfusing blood products that subsequently prove to be from an individual infected with a pathogen
5 Aledort, LM, Navickis, RJ and Wilkes, MM, 2011, Can B-domain deletion alter the immunogenicity of recombinant factor VIII? A meta-analysis of prospective clinical studies, Journal of Thrombosis and Haemostasis, 9:21802192. doi: 10.1111/j.15387836.2011.04472. Mannuccio P, Letter in JTH 10.1111/j.1538-7836.2011.04510. Iorio A, Marcucci M & Makris M Concentrate related inhibitor risk: Is a difference always real? JTH 10.1111/j.1538-7836.2011.04480. Aledort LM, Navickis RJ & Wilkes MM, Best evidence on B-domain deletion and the immunogenicity of recombinant factor VIII JTH 10.1111/j.1538-7836.2011.04496.