
Objective 1. Secure the supply of blood and blood products
It is the responsibility of the NBA to manage the national blood supply to ensure that healthcare providers have sustainable, reliable and efficient access to blood and blood products needed for patient care. NBA ensures blood supply security by working with states and territories to determine and manage an annual supply plan and budget and negotiating and managing blood supply contracts and arrangements with local and overseas suppliers.
National Supply Plan and Budget
A key element of the NBA’s role in ensuring security of supply is to develop, coordinate and monitor the annual National Supply Plan and Budget (NSP&B), including obtaining annual approval from health ministers.
This is achieved by:
- developing a national estimate of product demand
- liaising with states and territories to refine the estimated demand for products
- collecting and distributing data on product issued and reporting variations to jurisdictions on the approved supply plan
- intensively managing products if they are in short supply.
Performance against the 2012–13 NSP&B
Throughout 2012–13, products were supplied to meet clinical demand and supply risks were effectively managed. The approved budget for 2012–13 covering the supply and management of blood and blood products and services under contract was $1,095.08 million, comprising $580.63 million for fresh blood products and plasma collection (see Fresh blood products on p. 23) and $497.25 million for plasma and recombinant products (see Plasma and recombinant products on p.25). The remaining $17.2 million included items such as contributions for the NMF, interest monies, support for the Australian Haemophilia Centre Directors’ Organisation (AHCDO) and administration of the ABDR.
Table 2.1 identifies the NBA’s expenditure in 2012-13 and earlier years by supplier for the supply of products in each product category.
| Supplier | Products Purchased | 2008-09 ($M) | 2009-10 ($M) | 2010-11 ($M) | 2011-12 ($M) | 2012-13 ($M) |
|---|---|---|---|---|---|---|
| CSL Behring | Plasma Products
|
162.09 | 186.16 | 215.15 | 228.22 | 222.02 |
| Australian Red Cross Blood Service | Fresh Blood Products
|
432.62 | 456.12 | 496.57 | 526.35 | 549.31 |
| Baxter Healthcare Pty Ltd | Imported Plasma and Recombinant Products
|
84.09 | 90.62 | 96.93 | 45.95 | 33.06 |
| Bayer Australia Limited | Imported Plasma and Recombinant Products
|
Nil | Nil | Nil | 18.67 | 34.96 |
| Pfizer Australia Pty Ltd | Imported Plasma and Recombinant Products
|
48.65 | 48.94 | 57.03 | 66.55 | 93.28 |
| Novo Nordisk Pharmaceuticals Pty Ltd | Imported Plasma and Recombinant Products
|
17.40 | 26.42 | 27.37 | 24.55 | 33.60 |
| Octapharma Pty Ltd | Imported Plasma and Recombinant Products
|
46.90 | 48.69 | 8.95 | 23.38 | 49.10 |
| Lateral Grifols | Imported Plasma and Recombinant Products
|
Nil | Nil | 24.50 | 22.51 | 0.28 |
| Grifols Australia (DiaMed Australia Pty Ltd) | Diagnostic Reagent Products
|
0.92 | 0.81 | 0.60 | Nil | Nil |
| Ortho-Clinical Diagnostics (Johnson & Johnson Company) | Diagnostic Reagent Products
|
0.47 | 0.43 | 0.38 | 0.45 | 0.44 |
| Bio-Rad Laboratories Pty Ltd | Diagnostic Reagent Products
|
Nil | Nil | Nil | 0.13 | 0.63 |
| Abacus ALS Pty Ltd | Diagnostic Reagent Products
|
0.04 | 0.04 | 0.03 | 0.05 | 0.04 |
| Total Purchases of Blood and Blood Products | 793.18 | 858.23 | 927.51 | 956.81 | 1,016.72 |
Fresh blood products
The list of fresh blood products supplied in 2012-13 is at Appendix 2 Fresh blood components supplied under contract by the Blood Service. The four main products were:
- red blood cells
- platelets
- clinical fresh frozen plasma
- plasma for fractionation
TABLE 2.2 Fresh blood expenditure: increases on 2003–04 base year
| Year | Amount ($M) | Growth ($M) |
|---|---|---|
| 2003-04 | 247.8 | 0 |
| 2004-05 | 277.0 | 11.8 |
| 2005-06 | 297.7 | 7.5 |
| 2006-07 | 327.1 | 9.9 |
| 2007-08 | 369.1 | 12.8 |
| 2008-09 | 417.2 | 13.0 |
| 2009-10 | 456.1 | 9.3 |
| 2010-11 | 496.6 | 8.9 |
| 2011-12 | 526.3 | 6.0 |
| 2012-13 | 549.3 | 4.4 |
| Total | 3,964.2 | 8.4 (average) |
In the ten years to 2012–13, expenditure on fresh blood and plasma collections has increased from $247.8 million to $549.3 million. Of this, $171.9 million is due to price increases averaging 7.8 per cent per year. These price increases include major additional operational costs and investment in principal sites such as the Sydney and Melbourne processing centres. Demand for fresh products— principally red cells, platelets and plasma for fractionation—has been increasing at 3.1 per cent a year, resulting in additional expenditure of $67.2 million. A further $66.8 million is a consequence of the introduction of government-approved quality and safety measures such as the universal leucodepletion of platelets and red cells. These safety measures have resulted in an additional increase in expenditure averaging 3.1 per cent a year. The combined effect of these measures on expenditure can be seen in Figure 2.1
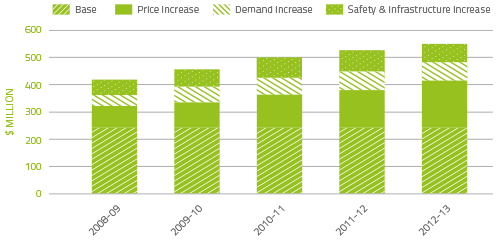
FIGURE 2.1 Fresh blood product expenditure: cumulative increases on 2003–04 base year
Red blood cells
Red blood cells comprise 28.5 per cent of total blood and blood product expenditure and are the largest single item of cost in fresh products. Figure 2.2 illustrates that there was a decline in issues of red blood cells (4.7 per cent) from 2011-12, with continuation of the steady decline in issues per 1,000 head of population. The decline in red cell demand is likely to demonstrate initial successes in programs to improve appropriate use and reduce wastage. The NBA and other blood sector stakeholders have been focused on practice improvement, including improving appropriate use through the publication and implementation of PBM Guidelines (see Reference Development on p.44) and decreased wastage through improved inventory management (see Best practice tools section on p.45).
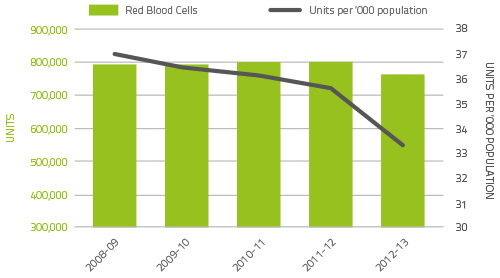
FIGURE 2.2 Red cells issued by the Blood Service, total packs issued and per ‘000 of population, 2008-09 to 2012-13
Platelets
Figure 2.3 illustrates that demand for platelets in 2012-13 was consistent with the demand in 2011-12 with only 0.3% growth. The constrained growth is again the result of the initial success of programs to improve appropriate use and reduce wastage. Platelets are either derived from an apheresis collection or a whole blood collection. In 2012-13, platelets issued were 62.4 per cent whole blood pooled (59.5 per cent in 2011-12) and 37.6 per cent apheresis (40.5 per cent in 2011-12).
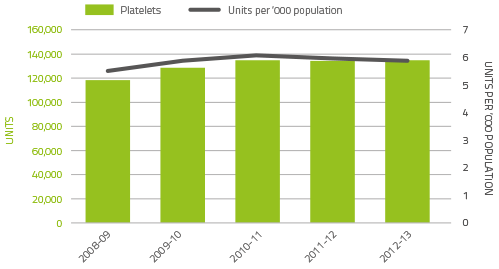
FIGURE 2.3 Platelets issued by the Blood Service, total packs issued and per ‘000 of population, 2008-09 to 2012-13
Plasma for fractionation
The Blood Service collects plasma for fractionation to supply to CSL Behring Ltd for the manufacture of plasma products. In 2012-13, the target for the quantity of plasma to be collected by the Blood Service was 525 tonnes, with the total collected by the Blood Service being 525.2 tonnes (see Table 2.3).
TABLE 2.3 Blood Service: plasma volumes collected for fractionation (tonnes), 2003–04 to 2012–13
| 2003-04 | 2004-05 | 2005-06 | 2006-07 | 2007-08 | 2008-09 | 2009-10 | 2010-11 | 2011-12 | 2012-13 |
|---|---|---|---|---|---|---|---|---|---|
| 294.5 | 308.1 | 308.4 | 329.3 | 352.8 | 390.7 | 452.4 | 472.3 | 502.2 | 525.2 |
Plasma and recombinant products
The cost of plasma derived and recombinant blood products issued under NBA arrangements in 2012–13 increased to $463.98 million, an increase of $37.47 million (8.8 per cent) from 2011–12. The largest proportion of this increase was due to increased product demand, notably for IVIg, recombinant factor eight (rFVIII) and recombinant factor seven (A) (rFVIIa). Prices for most products increased by less than 2 per cent, and the average unit price for domestically produced IVIg increased by less than 1 per cent due to the favourable price structure under the CSL Australian Fractionation Agreement (CAFA).
In the ten years to 2012-13, expenditure on plasma and recombinant products issued under NBA arrangements has increased from $205.2 million to $463.98 million. The components of this increase are shown in Figure 2.4. A substantial component of the increase, $220.6 million, is due to demand increases. A further $51.8 million is a consequence of the safety based government policy decision to introduce full funding to allow access to recombinant clotting factor products (rFVIII and rFIX). In different periods, the contribution of price has either been a small increase, or a small to moderate saving. The average contribution of price changes over ten years since 2003-04 has been a reduction in expenditure of 5.4 per cent per year.
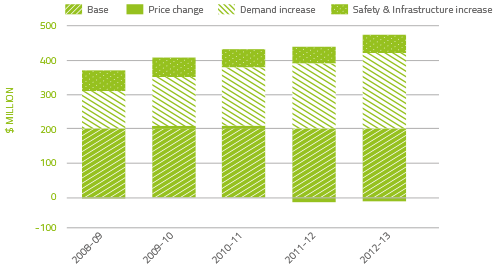
FIGURE 2.4 Plasma derived and overseas product expenditure: cumulative increases on 2003–04 base year
Issues of clotting factors
Figure 2.5 indicates that the demand for Factor VIII products grew by just 1 per cent when compared to 2011–12. The demand for plasma derived product has decreased significantly from 33.2 per cent growth in 2010-11 to a 2.5 per cent growth in demand in 2012-13. Demand for rFVIII has stabilised in 2012-13 with a growth of 0.8 per cent compared to a growth of 8.6 per cent in 2010-11.
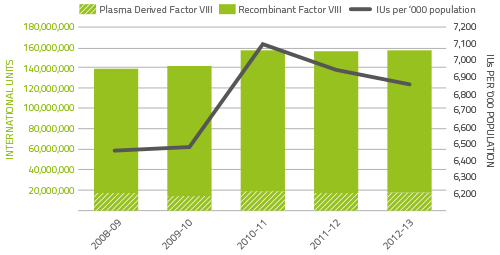
FIGURE 2.5 Issues of Factor VIII products, 2008–09 to 2012–13
Demand for factor nine (FIX) products in 2012–13 increased by 6.75 per cent compared to 2011-12. This is a significant adjustment in demand when compared to the 4.4 per cent reduction seen in 2011-12 (see Figure 2.6). The variability in year-to-year growth rates for both FVIII and FIX products appears to be partly due to patients commencing and ceasing participation in company clinical trials.
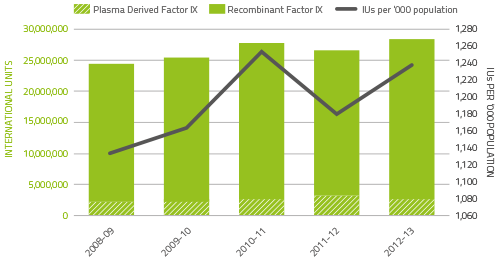
FIGURE 2.6 Issues of Factor IX products, 2008–09 to 2012–13
The demand for rFVIIa and factor eight inhibitor bypass agent (FEIBA) may be considerably affected by a small number of patients experiencing very high needs from time to time (see Figures 2.7 and 2.8). The 2012–13 level of demand for rFVIIa was 36.4 per cent above the 2011-12 issues. A major influence of this was a higher than usual number of acquired haemophilia A patients requiring treatment. FEIBA demand has continued to reduce with demand in 2012-13 exhibiting a 31 per cent decline compared to 2011-12.
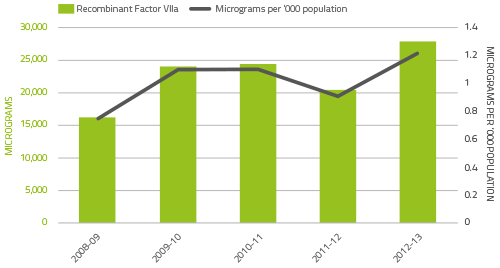
FIGURE 2.7 Issues of recombinant Factor VIIa products, 2008–09 to 2012–13
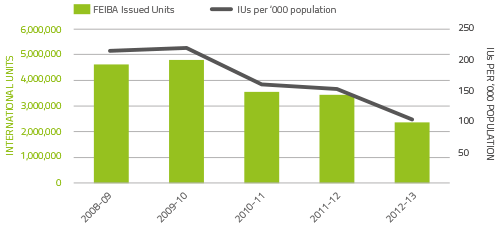
FIGURE 2.8 Issues of FEIBA, 2008–09 to 2012–13
Issues of immunoglobulin: IVIg and NIg
Figure 2.9 indicates that growth in demand for IVIg has continued at around 11 per cent since 2007-08. However this demand has slowed marginally in recent years. The table below shows the year-on-year demand growth for this product.
| 2008-09 | 2009-10 | 2010-11 | 2011-12 | 2012-13 |
|---|---|---|---|---|
| 10.6% | 11.6% | 11.1% | 10.9% | 10.7% |
In 2012–13, a total of 3.62 million grams of IVIg was issued, representing a cost of $221 million nationally (excluding cost of plasma collections). Of this, 62.2 per cent was IVIg produced in Australia and 37.8 per cent was imported. Excluding IVIg issued under direct orders, a total of 13,138 (compared with 12,130 in 2011-12) patients nationally were issued IVIg during 94,733 treatment episodes (101,388 in 2011-12).
The NBA produced an annual report of IVIg usage in 2011–12, in order to document the trends in the use of IVIg and provide insights into the drivers of use at the micro level. It draws on records of issues and purchases data held by the NBA, and application of IVIg to clinical indications from the Blood Service STARS database.
An analysis of IVIg use indicates that there are still considerable variations in the grams issued per treatment episode across jurisdictions for some conditions. Neurology remains the discipline using the greatest amount of IVIg and demand is still increasing. Haematology is the next largest user of IVIg but growth has slowed within this discipline. A similar decline in growth has been observed in immunology, the third largest user of IVIg. The top three indications for which IVIg is issued most frequently are acquired hypogammaglobulinaemia secondary to haematological malignancies, chronic inflammatory demyelinating polyneuropathy and common variable immunodeficiency disease.
The Report on the Issue and Use of IVIg 2011-12 can be found on the NBA website at www.blood.gov.au/data-analysis-reporting.
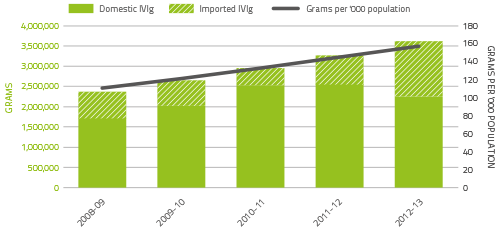
FIGURE 2.9 Issues of IVIg products, 2008–09 to 2012–13
In 2012–13 there was again significant demand for normal immunoglobulin (NIg) although the growth in demand tempered. CSL Behring produces NIg from hyperimmune plasma specially collected by the Blood Service. The volume of product is limited by the availability of this specialised plasma, and by production scheduling arrangements in CSL Behring’s manufacturing facility. The increase in demand for NIg is a result of NIg use as a subcutaneous alternative to IVIg.
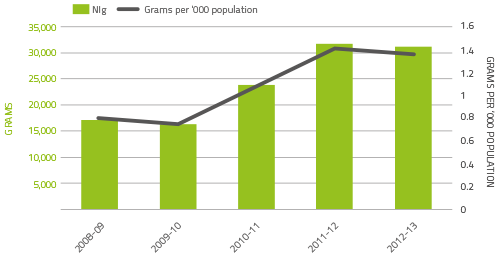
FIGURE 2.10 Issues of NIg, 2008–09 to 2012–13
Contract Management
Maintaining security of supply also requires the NBA to manage contracts with suppliers of blood and blood products. Contracts are developed in accordance with the Commonwealth Procurement Rules, and managed in accordance with best practice guidance for contract management, including the guideline from the Australian National Audit Office (ANAO) on Developing and Managing Contracts.
In 2012-13 the NBA managed 18 blood and blood product supply contracts and arrangements.
The contracts managed by the NBA included:
- fresh blood product procurement - Australia’s fresh blood component requirements through the Deed of Agreement with the Australian Red Cross Society
- plasma and recombinant product procurement - Australia’s plasma product and recombinant product requirements through:
- the CSL Australian Fractionation Agreement (CAFA)
- contracts for the provision of imported IVIg, imported recombinant factors VIIa, VIII, IX, and XIII, and other imported plasma and recombinant products
- red cell diagnostic reagents product procurement.
Deed of Agreement with the Blood Service
The provision of fresh blood products is an essential service for all Australians, and all governments are committed to ensuring a secure supply of fresh blood components to meet the clinical needs of patients in Australia. The Blood Service is the sole supplier of fresh blood products in Australia and NBA is responsible for negotiating improvements to current arrangements and managing the deed with the Blood Service.
Funding provided to the Blood Service is based on an output based funding model arrangement that commenced on 1 July 2010. Funding provided to the Blood Service through the deed was $549.3 million in 2012–13, an increase of $23 million over the $526.3 million in 2011–12.
Performance
The performance of the Blood Service is a key element in meeting blood sector objectives. Governments expect the Blood Service to deliver effective services at optimum value for money. Governments outline their expectations of the Blood Service in relation to performance through the Deed of Agreement and the Blood Service Statement of Expectations. The Blood Service underachievement of 21,900 donors against the target donor base of 489,100 for whole blood in 2012-13 was due to a reduction in the demand by 7.3 per cent for red blood cells compared to budget. Blood Service performance against selected indicators is outlined Table 2.4.
TABLE 2.4 Blood Service: selected key performance indicators, 2012-13
| Domain | Indicator | 2011-12 result* | 2012-13 Blood Service target | 2012-13 result* | ||||||||||||||||
|---|---|---|---|---|---|---|---|---|---|---|---|---|---|---|---|---|---|---|---|---|
| Donor management | Size of the donor base
|
|
|
|
||||||||||||||||
| Supply chain management |
|
|
|
|
||||||||||||||||
| Quality and level of service | Health provider satisfaction with Blood Service (mean score out of 10) | 8.6 | 8.7 | 8.6 | ||||||||||||||||
| Finance | Main operating program financial result | $6.2 million surplus | >0 | $12.5 million surplus |
* As measured by the Blood Service.
Implementing improvements to current arrangements
The NBA worked with the Blood Service to deliver a range of contract improvements in 2012-13, including the following:
- Negotiation and ministerial approval of a new Statement of Expectations for 2013-16.
- Development of national service requirements and standards that will set out the Blood Service’s relationships with health providers and the NBA. This includes business rules and standards for ordering, delivery, and acceptance of products and will guide the Blood Service in developing consistent service levels for all health providers.
- Finalisation of a 2006 deed request to agree on a handover plan that will guide the actions of the NBA and Red Cross should the deed terminate or expire.
- Development and implementation of the second cycle of the OBFM, which defines the products and services to be delivered under the contractual arrangements and product prices to be paid to the Blood Service.
- Extension of the current deed by mutual agreement until 30 June 2014.
CSL Australian Fractionation Agreement
Most plasma derived products used in Australia are manufactured by CSL Behring under the CSL Australian Fractionation Agreement (CAFA), from plasma collected by the Australian Red Cross Blood Service (Blood Service).
The CAFA came into operation on 1 January 2010 and, subject to government review in 2014, will continue until 31 December 2017. It sets out CSL Behring’s obligations regarding plasma, stewardship, production, inventory management, product quality, pricing and payments, supply, reporting and performance, and risk management. In 2012-13, 517 tonnes of Australian plasma was pooled for fractionation under the CAFA, and expenditure on CAFA products during 2012-13 was $185.7 million.
Performance
The 2012-13 performance of CSL Behring against the CAFA KPIs is shown in Table 2.5. This table reports actual performance. Sufficient supply of all products was maintained at all times. There are a range of tolerances for each of the KPIs under the CAFA, and CSL Behring’s performance fell within the tolerances with few exceptions. Some approvals for KPI deviations were given to the NBA where known issues beyond the control of CSL Behring, including changes in the level of immunoglobulin in plasma, and the dynamics of supply, demand and production for some products, affected CSL Behring’s ability to meet KPI standards.
TABLE 2.5 CSL Ltd’s performance under the CAFA, 2012-13
| Description of performance measure | Results 2012-13 | |||||
|---|---|---|---|---|---|---|
| Q1 | Q2 | Q3 | Q4 | Annual | ||
| KPI1 | Plasma stewardship | Achieved | Achieved | Substantially achieved* | Achieved | Substantially achieved |
| KPI2* | Production yield | 5.26g/kg | 5.19g/kg | 4.81g/kg | 4.87g/kg | 5.02g/kg |
| KPI3 | Management of required inventory levels | |||||
| Minimum starting plasma inventory | Not active in 2012-13 | |||||
| Products in CSL Inventory | 99% Achieved** | 98% Achieved** | 95% Achieved | 99% Achieved** | 98% Achieved | |
| Products in national CSL reserve | 100% Achieved | 100% Achieved | 100% Achieved | 97% Achieved | 99% Achieved | |
| KPI4 | Fulfillment of orders | |||||
| Orders by distributor (Blood Service) | 100% Achieved | 100% Achieved | 100% Achieved | 100% Achieved | 100% Achieved | |
| Orders by non-distributor | 98% Achieved | 99% Achieved | 96% Achieved | 97% Achieved | 97% Achieved | |
| KPI5*** | Shelf life of national reserve products | 96% Achieved | 80% Achieved | 88% Achieved | 82% Achieved | 87% Achieved |
Note:
* The NBA and CSL are considering the effects of changes in plasma collection practices on CAFA contractual provisions relating to IVIg yield.
** The NBA gave approval for CSL to access reserve inventory in order to ensure supply.
*** The NBA have agreed that, as an interim measure, the minimum required shelf life of some hyperimmune products held in the National CSL
Reserve will be reduced to avoid surplus production. CSL’s performance is substantially in line with this agreement.
Service delivery
During 2012-13 the NBA approved the supply of a new CSL Behring product – Evogam (16% concentration immunoglobulin for subcutaneous administration).
Imported intravenous immunoglobulin
Intravenous immunoglobulin (IVIg) is imported to meet a shortfall in domestic IVIg production against clinical demand in Australia. In addition to supply under the national blood arrangements, the NBA also supports the purchasing of small amounts of imported IVIg using jurisdictional direct orders.
Two contracts are in place for supply of imported IVIg under the national blood arrangements. The contracts commenced on 1 January 2012 for a period of three years and have provision for a one year extension. The suppliers are Baxter Healthcare Pty Ltd and Octapharma Australia Pty Ltd. In 2012-13, the NBA spent $75.86 million for both contracts.
Performance
The 2012-13 performance of both suppliers against the contractual key performance indicators is shown in Table 2.6. Sufficient supply of products was maintained at all times in accordance with contractual requirements and was not affected by transient or administrative KPI deviations.
TABLE 2.6 Imported IVIg: Key performance indicators, by supplier, 2012-13
| Performance | Octapharma Australia | Baxter Healthcare | |
|---|---|---|---|
| KPI1 | In-country reserve | Substantially achieved | Fully achieved |
| KPI2 | Shelf life on products delivered | Fully achieved | Fully achieved |
| KPI3 | Delivery performance | Substantially achieved | Substantially achieved |
| KPI4 | Reporting accuracy and timeliness | Substantially achieved | Not achieved |
Service Delivery
A voluntary recall of Octagam 10% was initiated by Octapharma Australia on 5 September 2012, resulting in the return of 299 units from the Blood Service and hospitals throughout Australia. Additionally, a further batch of Octagam 5% was quarantined on 9 May 2013, and subsequently recalled. These actions did not impact on supply availability of IVIg.
A new Octapharma product, Gammanorm (16% immunoglobulin for subcutaneous administration) was approved for supply under the national blood arrangements for specified indications. Baxter’s Kiovig 10% was also approved for supply under this program.
Imported plasma derived and recombinant blood products
The NBA has contracts with suppliers for the importation of selected plasma derived and recombinant blood products to augment domestic supply where these products are not produced in Australia or domestic production cannot meet demand.
In 2012-13, the NBA managed the supply contracts for imported plasma and recombinant products with the following five companies:
- Bayer Australia Ltd
- Baxter Healthcare Pty Ltd
- CSL Behring Ltd
- Novo Nordisk Pharmaceuticals
- Pfizer Australia Pty Ltd
The supply contracts for the above suppliers commenced on 1 July 2011 and have a term of three years, with a possible extension of up to two years. Expenditure on the contracts during 2012-13 was $168.9 million.
TABLE 2.7 Imported plasma and recombinant blood products: key performance indicators, by supplier, 2012-13
| Performance | Baxter Healthcare | Bayer Australia | CSL Behring | Pfizer Australia | Novo Nordisk Pharmaceuticals | |
|---|---|---|---|---|---|---|
| KPI1 | In-country reserve | Fully achieved | Fully achieved | Fully achieved | Fully achieved | Fully achieved |
| KPI2 | Shelf life on products delivered | Achieved* | Achieved* | Achieved* | Fully achieved | Achieved* |
| KPI3 | Delivery performance | Subject to transitional arrangements** | ||||
| KPI4 | Reporting accuracy and timeliness | Achieved* | Achieved* | Achieved* | Achieved* | Achieved* |
*In these instances, the performance of the relevant supplier departed from the contracted requirement at some periods during the year, but without material effect on supply performance or supply security. Such instances are managed through prior approvals from the NBA, and discussion of supplier performance at regular contract management meetings.
** In these instances, the reporting requirements were subject to establishment of new contract management arrangements. Performance of the relevant suppliers was nonetheless subject to contractual requirements and was managed through regular contract management meetings.
Red cell diagnostic reagent products
Red cell diagnostic reagents are used for testing to establish the blood group of human red cells, detect red cell antibodies and to control, standardise and validate routine haematology tests.
The NBA has established a standing offer arrangement with the following five suppliers for the period 1 July 2011 to 30 June 2014:
- Abacus ALS
- Bio-RAD Laboratories
- CSL Behring
- Lateral Diagnostics
- Ortho-Clinical Diagnostics
The standing offer lists more than 130 red cell diagnostic products, which are used in laboratory tests known as blood typing and cross matching. These tests ensure that when a person needs a blood transfusion, they receive blood that is compatible with their own.
Expenditure on diagnostic reagent supply is capped at $4.8 million per year. The NBA manages the cap for all jurisdictions and suppliers.