You are here
Objective 1. Secure the supply of blood and blood products
It is the responsibility of the National Blood Authority (NBA) to manage the national blood supply to ensure that healthcare providers have sustainable, reliable and efficient access to blood and blood products needed for patient care. The NBA ensures blood supply security by working with states and territories to determine and manage an annual supply plan and budget and negotiating and managing blood supply contracts and arrangements with local and overseas suppliers.
National Supply Plan and Budget
A key element of the NBA's role in ensuring security of supply is to develop, coordinate and monitor the annual National Supply Plan and Budget (NSP&B), including obtaining annual approval from health ministers.
This is achieved by:
- developing a national estimate of product demand
- liaising with states and territories to refine the estimated demand for products
- collecting and distributing data on product issued and reporting variations to jurisdictions on the approved supply plan
- intensively managing products if they are in short supply.
Performance against the 2016-17 NSP&B
Throughout 2016-17, products were supplied to meet clinical demand and supply risks were effectively managed. The approved budget for 2016-17 covering the supply and management of blood and blood products and services under contract was $1,153.17 million, comprising $614.63 million for fresh blood products and plasma collection (see Fresh blood products) and $519.04 million for plasma and recombinant products (see Plasma and recombinant products). The remaining $19.49 million included items such as support for the publication of PBM Guidelines, maintenance of the Australian Haemophilia Centre Directors' Organisation (AHCDO), administration of the Australian Bleeding Disorders Registry (ABDR) and operations of the NBA. Table 2.1 identifies the NBA's expenditure in 2016-17 and earlier years by supplier for the supply of products in each product category.
TABLE 2.1 Blood and blood products purchased, by supplier, 2012-13 to 2016-17.
|
Supplier |
Products Purchased |
2012-13 ($M) |
2013-14 ($M) |
2014-15 ($M) |
2015-16 ($M) |
2016-17 ($M) |
|---|---|---|---|---|---|---|
|
CSL Behring (Australia) Pty Ltd |
Plasma Products
Diagnostic Reagent Products
Imported Plasma and Recombinant Products
|
222.02 |
210.10 |
245.19 |
282.49 |
351.83 |
|
Australian Red |
Fresh Blood Products
|
549.31 |
583.13 |
547.10 |
588.40 |
582.40 |
|
Baxalta Australia |
Imported Plasma and Recombinant Products
|
6.302 |
8.25 |
29.11 |
36.62 |
31.45 |
| Imported IVIg |
26.76 |
29.20 | 40.30 | 28.35 | 0.00 | |
|
Bayer Australia Limited |
Imported Plasma and Recombinant Products
|
34.96 |
35.14 |
9.00 |
1.07 |
0.00 |
|
Pfizer Australia Pty Ltd |
Imported Plasma and Recombinant Products
|
93.28 |
93.05 |
54.66 |
56.48 |
56.89 |
|
Novo Nordisk Pharmaceuticals |
Imported Plasma and Recombinant Products
|
33.60 |
27.20 |
32.81 |
36.39 |
24.20 |
|
Octapharma Pty Ltd |
Imported IVIg |
49.10 |
46.00 |
70.02 |
47.05 |
0.00 |
|
Grifols Australia |
Imported IVIg Diagnostic Reagent Products
|
0.28 0.00 |
0.00 0.32 |
0.00 0.41 |
11.58 0.36 |
36.30 0.33 |
|
Ortho-Clinical Diagnostics (Johnson & Johnson Medical Pty Ltd) |
Diagnostic Reagent Products
|
0.44 |
0.43 |
0.44 |
0.43 |
0.44 |
|
Bio-Rad |
Diagnostic Reagent Products
|
0.63 |
0.57 |
0.52 |
0.48 |
0.54 |
|
Abacus ALS Pty Ltd |
Diagnostic Reagent Products
|
0.04 |
0.04 |
0.00 |
0.00 |
0.00 |
|
Total Purchases of Blood and Blood Products |
1,016.72 |
1,033.43 |
1,029.56 |
1,089.70 |
1,084.40 |
|
1 With effect from 1 April 2015, all NBA contracts with Baxter Healthcare Pty Ltd were novated to Baxalta Australia Pty Ltd.
Throughout this report, references are made to Baxalta Australia Pty Ltd.
2 In the 2012-13 annual report, Baxter Healthcare Pty Ltd imported Plasma and Recombinant Products figure of 33.06 included 6.30 Imported IVIg which has a category in subsequent reports. Care should be taken in making comparisons with previous reports.
Fresh blood products
The list of fresh blood products supplied in 2016-17 is at Appendix 2 Fresh blood components supplied under contract by the Blood Service. The four main products were:
- red blood cells
- platelets
- clinical fresh frozen plasma
- plasma for fractionation.
As demonstrated in Table 2.2, the increase in fresh blood expenditure has progressively moderated over the last 10 years primarily as a result of improved efficiencies in Blood Service operations, and in the last five years, a significant reduction in the demand for some fresh blood products due to improved appropriate use and reduced wastage.
TABLE 2.2 Fresh blood expenditure: increases over the last 10 years
|
Year |
Amount ($M) |
Growth (%) |
|---|---|---|
|
2007-08 |
369.1 |
12.8 |
|
2008-09 |
417.2 |
13.0 |
|
2009-10 |
456.1 |
9.3 |
|
2010-11 |
496.6 |
8.9 |
|
2011-12 |
526.3 |
6.0 |
|
2012-13 |
549.3 |
4.4 |
|
2013-14 |
583.1 |
6.2 |
|
2014-15 |
547.1 |
-6.2 |
|
2015-16 |
588.4 |
7.5 |
|
2016-17 |
582.4 |
-1.0 |
|
Total |
5115.6 |
6.09 (average) |
Fresh blood expenditure in 2016-17 compared to 2015-16 decreased by 1.0 per cent. Key factors that have influenced the changes include the following:
- an increase in the quantity of collected plasma for fractionation from 601 tonnes to 637 tonnes
- rebased Output Based Funding Model (OBFM) to be based on the 2014-15 actual operating costs of the Blood Service, as well as restrained annual price indexation to 2.95 per cent
- reduction in demand for some fresh products as a result of improved appropriate use and reduced wastage.
Since the implementation of the OBFM in 2010-11 where governments paid for the actual costs of producing fresh blood products supplied by the Blood Service rather than a grant based funding model, the NBA has seen returns to government year on year as highlighted in Figure 2.1. In 2016-17, $34.4 million was returned including $22.3 million for the Blood Service operating surplus and a saving from the decrease in red blood cell demand of 1.4 per cent. This compared to $63.1 million in 2015-16 (which included $42.4 million operating surplus and 3.4 per cent reduction in red blood cell demand).
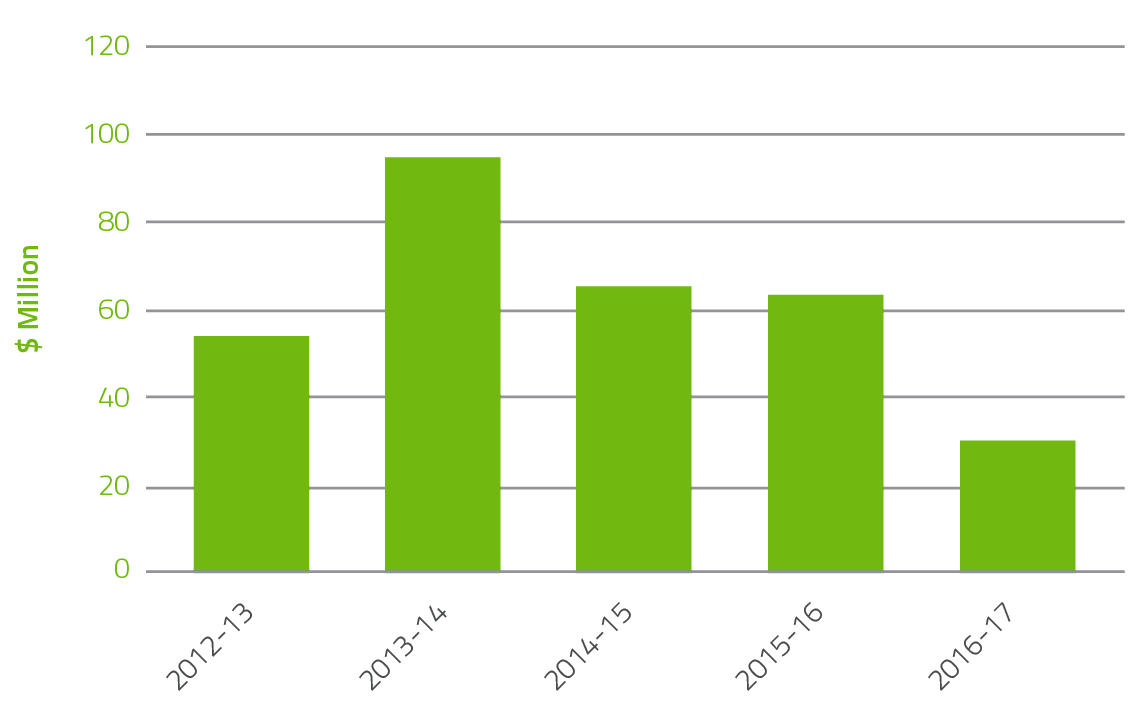
FIGURE 2.1 Returns to Government 2012-13 to 2016-17
Red blood cells
Red blood cells comprise approximately 23.6 per cent of total blood and blood product expenditure and are the largest item of cost in fresh products. Figure 2.2 illustrates that there was a decline in issues of red blood cells (1.4 per cent) compared to 2015-16, with continuation of the steady decline in issues per 1,000 head of population nationally from 33.3 in 2012-13 to 26.1 in 2016-17. In the last five years, demand for red cells has declined by 22 per cent, realising a saving in excess of
$103 million. The decline in red cell demand is the result of the ongoing success of programs to improve appropriate use and reduce wastage. These programs encompass a range of health provider and clinical engagement activities, development of best practice guidelines and tools, improved data collection and analysis and improved education and training arrangements.
The publication and implementation of the PBM Guidelines underpins much of the success in improving appropriate use of fresh blood products.
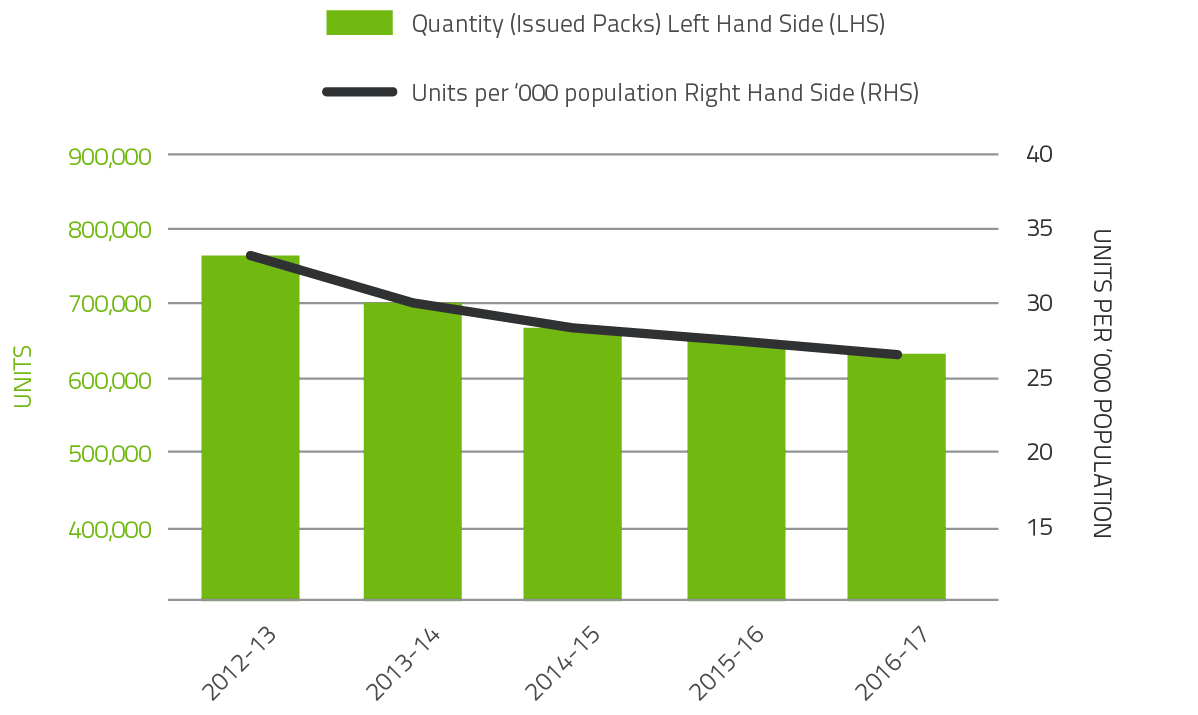
FIGURE 2.2 Red Cells issued by the Blood Service and per '000 population 2012-13 to 2016-17
Platelets
Platelets comprise 4.8 per cent of total blood and blood product expenditure. Figure 2.3 illustrates that there was no change in issues of platelets from 2015-16 and a small decrease in issues per 1,000 head of population. Platelets are either derived from an apheresis collection or a whole blood collection. In 2016-17, platelets issued were 64.6 per cent whole blood pooled (65.0 per cent in 2015-16) and 35.4 per cent apheresis (35.0 per cent in 2015-16).
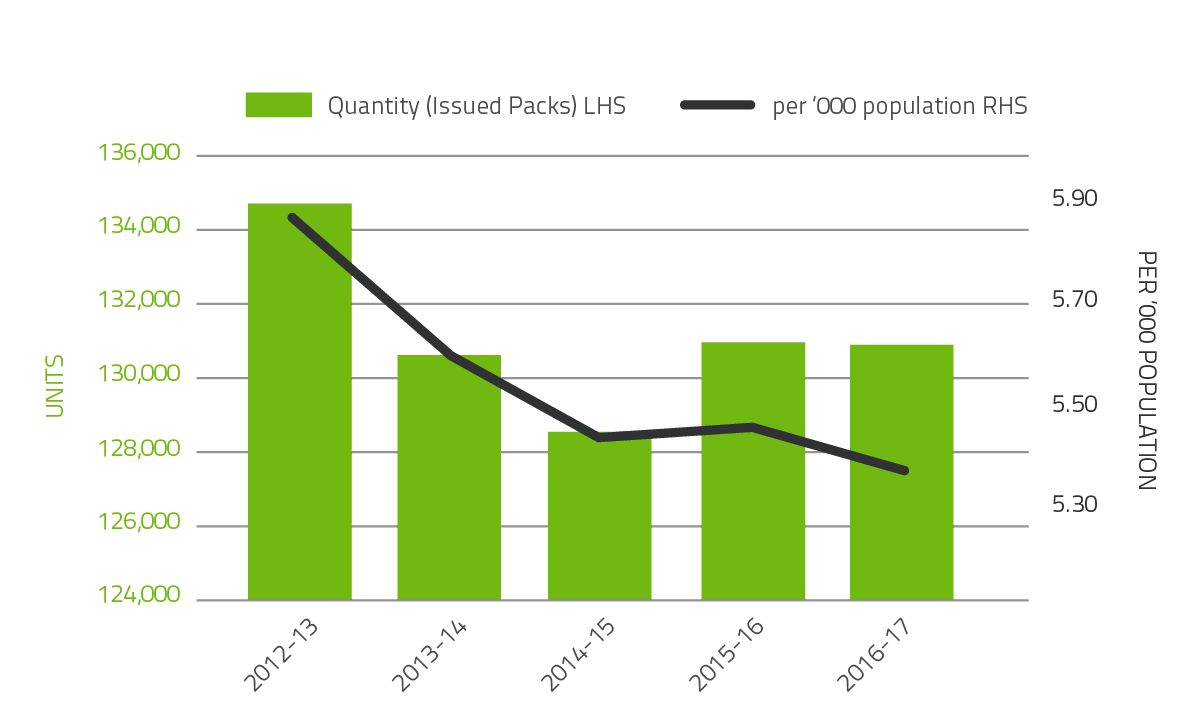
FIGURE 2.3 Platelets issued by the Blood Service and per '000 population 2012-13 to 2016-17
Plasma for fractionation
The Blood Service collects plasma for fractionation to supply to CSL Behring (Australia) Pty Ltd for the manufacture of plasma derived products. In 2016-17, the target for the quantity of plasma to be collected by the Blood Service was 631 tonnes. The Blood Service collections for 2016-17 were successful, with supply to CSL being 6 tonnes over target. The growth in apheresis plasma collection by the Blood Service over the last five years is shown in Figure 2.4 below. In 2012-13 the ratio of whole blood to apheresis plasma for fractionation was 37:63 and in 2016-17 28:72. This is in part due to the decline in red blood cell demand.
The growth in plasma collection for 2016-17 is consistent with governments' target of 5 per cent per annum.
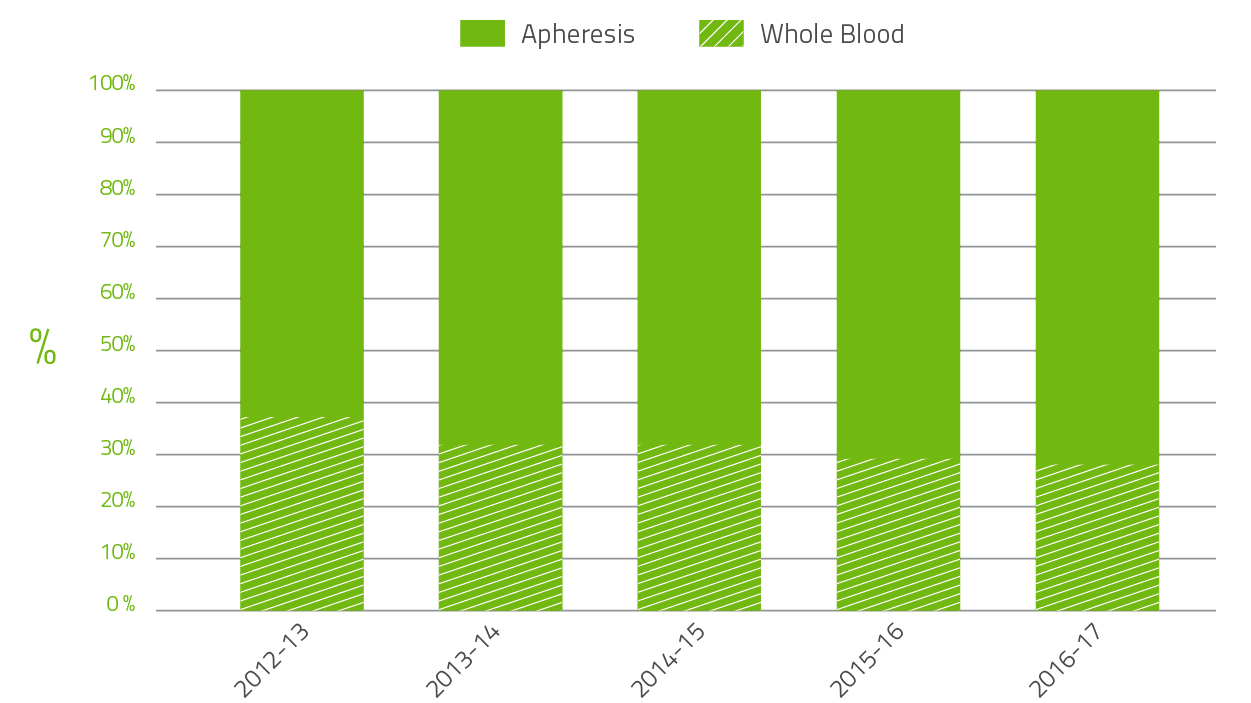
FIGURE 2.4 Whole blood to apheresis plasma for fractionation 2012-13 to 2016-17
Plasma and recombinant products
The cost of plasma derived and recombinant blood products issued under NBA arrangements in 2016-17 totalled $504.6 million, an increase of $0.5 million (0.1 per cent) from 2015-16. Increases in volumes for immunoglobulin (Ig), 11.2 per cent, and plasma derived factor VIII, 8.9 per cent, were the dominant factors relating to the growth in expenditure. Conversely, there were large reductions in demand for recombinant factor VIIa, 34.4 per cent and FEIBA, 45.2 per cent due to ongoing product trials in Australia. In addition there were cost reductions in recombinant factors VIII and IX following successful negotiations during recent procurement consultations that resulted in lower prices for these products. The cost of most other products increased by less than 2 per cent. The average unit price for domestically produced Ig decreased by 1.2 per cent due to the favourable price structure under the CSL Australian Fractionation Agreement (CAFA) in which price decreases with increases in volume.
In the 14 years to 2016-17, expenditure on plasma and recombinant products issued under NBA arrangements has increased from $205.2 million to $504.6 million. Key drivers of this increase are:
- $337.9 million from increased demand
- $51.8 million due to the safety based government policy decision to fund recombinant clotting factor products (rFVIII and rFIX).
The combined effect of demand and price drivers on expenditure can be seen in Figure 2.5.
It is of note that significant improvements in price have driven a large increase in savings.
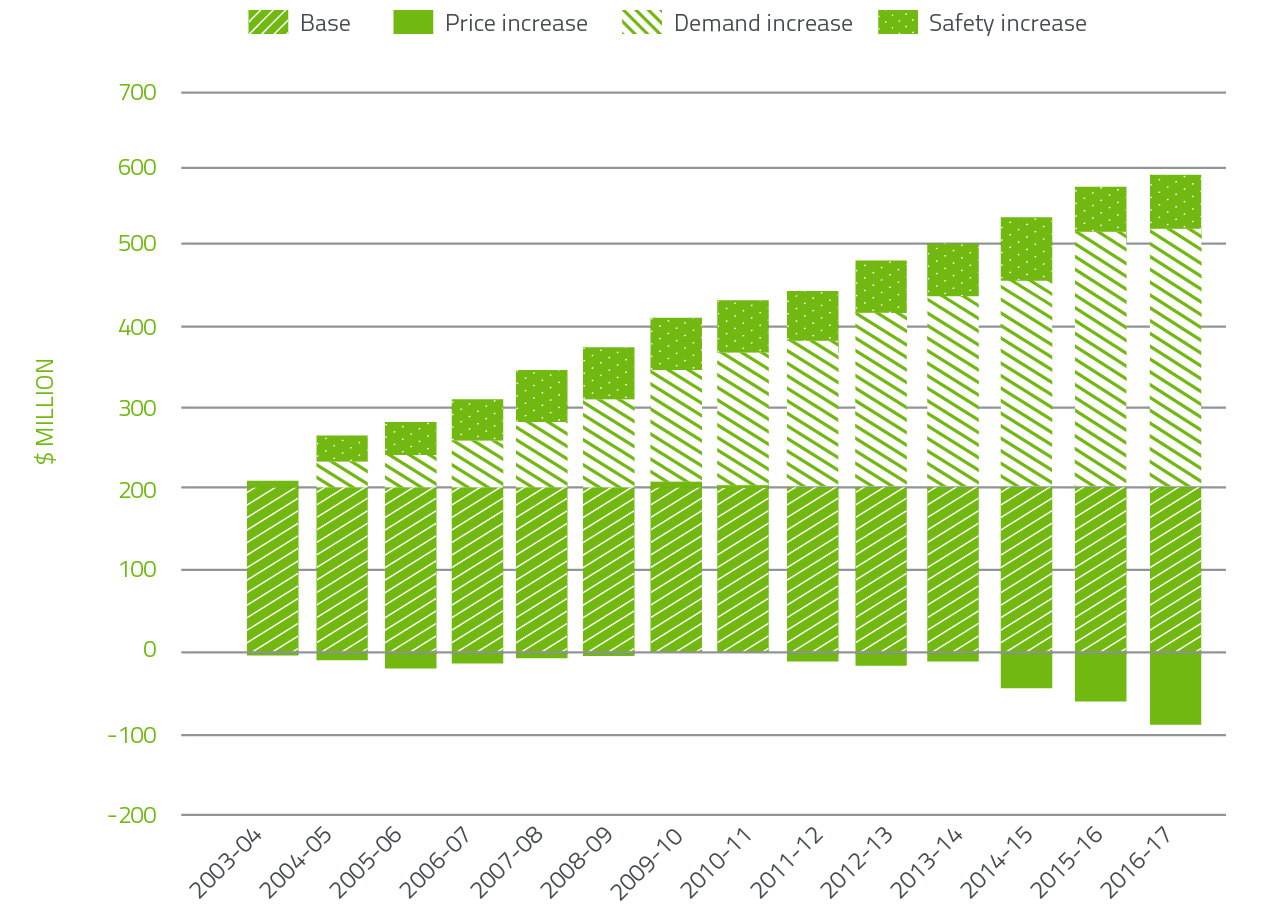
FIGURE 2.5 Plasma derived and overseas product expenditure: cumulative increases on 2003-04 base year
Issues of clotting factors
In 2016-17, clotting factors comprised 12.1 per cent of total blood and blood product expenditure. Figure 2.6 indicates that the demand for Factor VIII products increased by 1.5 per cent when compared to 2015-16. The demand for recombinant Factor VIII decreased by 0.5 per cent over 2015-16. Plasma derived Factor VIII demand increased by 18.9 per cent.
Patient participation in company clinical trials for recombinant Factor VIII products continues to contribute to the variability of year-to-year product growth.
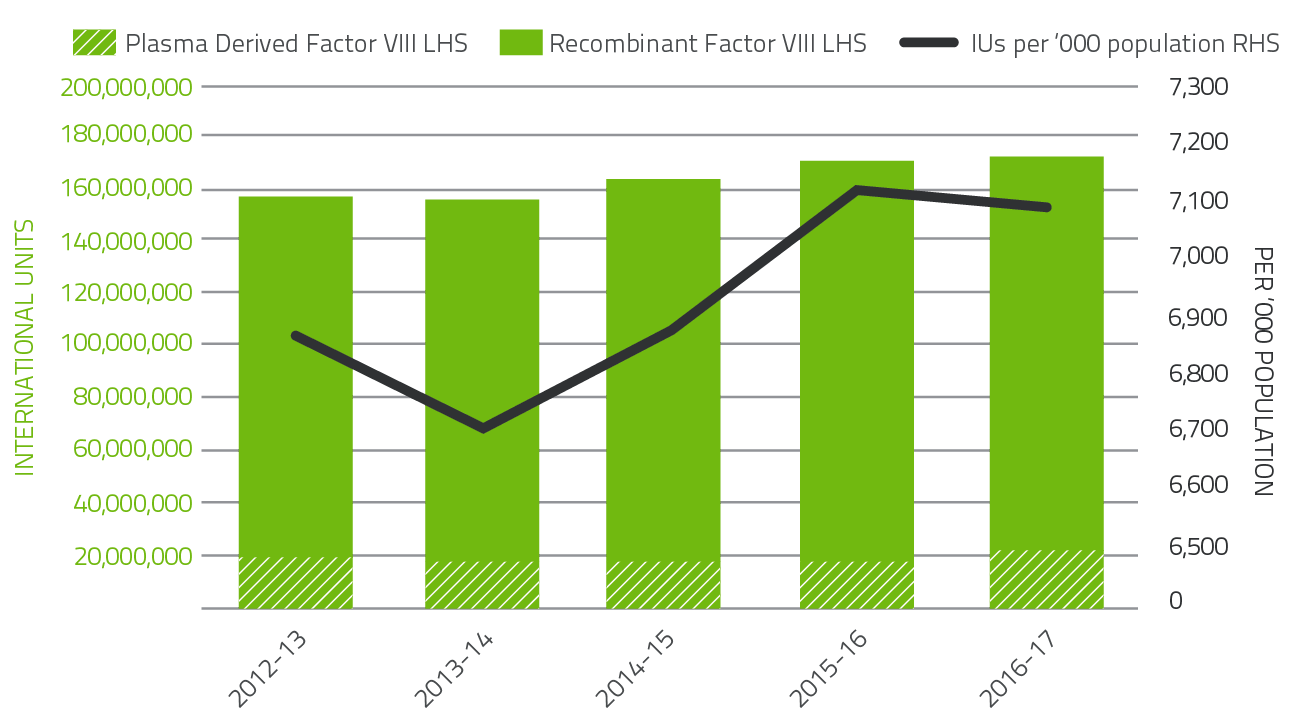
FIGURE 2.6 Issues of Factor VIII products 2012-13 to 2016-17 per '000 population
Figure 2.7 indicates that demand for Factor IX products in 2016-17 increased by 1.6 per cent compared to 2015-16. Plasma derived Factor IX demand decreased by 15.6 per cent in 2016-17 due to a reduction in specific patient requirements. Demand for Recombinant Factor IX increased by 1.6 per cent in 2016-17.
Patient participation in company clinical trials for recombinant Factor IX products continues to contribute to the variability of year-to-year product growth.
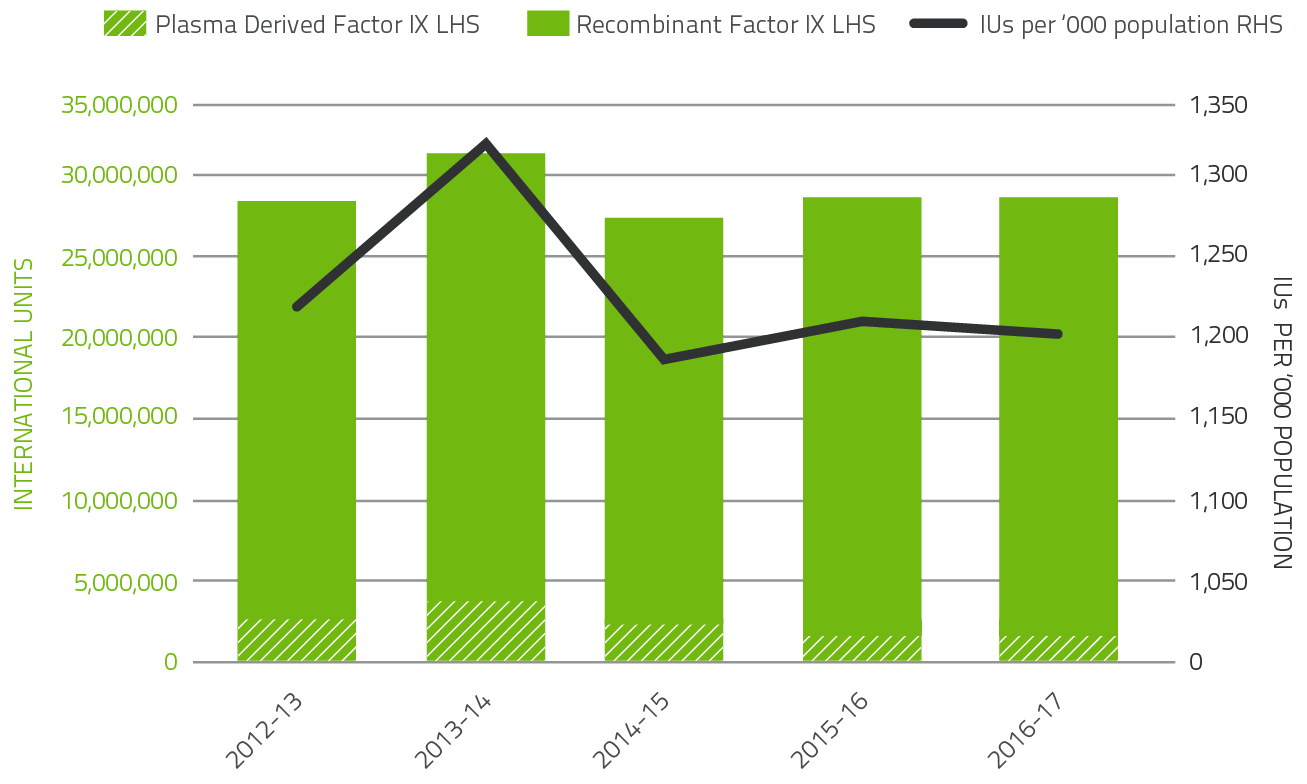
FIGURE 2.7 Issues of Factor IX products 2012-13 to 2016-17 per '000 population
The 2016-17 level of demand for Recombinant Factor VIIa decreased by 34.4 per cent and 45.2 per cent for FEIBA compared to 2015-16. Demand for Recombinant Factor VIIa and FEIBA can change significantly from year to year as a result of the variable needs of a small number of patients.
These products have also been variable due to ongoing clinical trials in the clotting factor space.
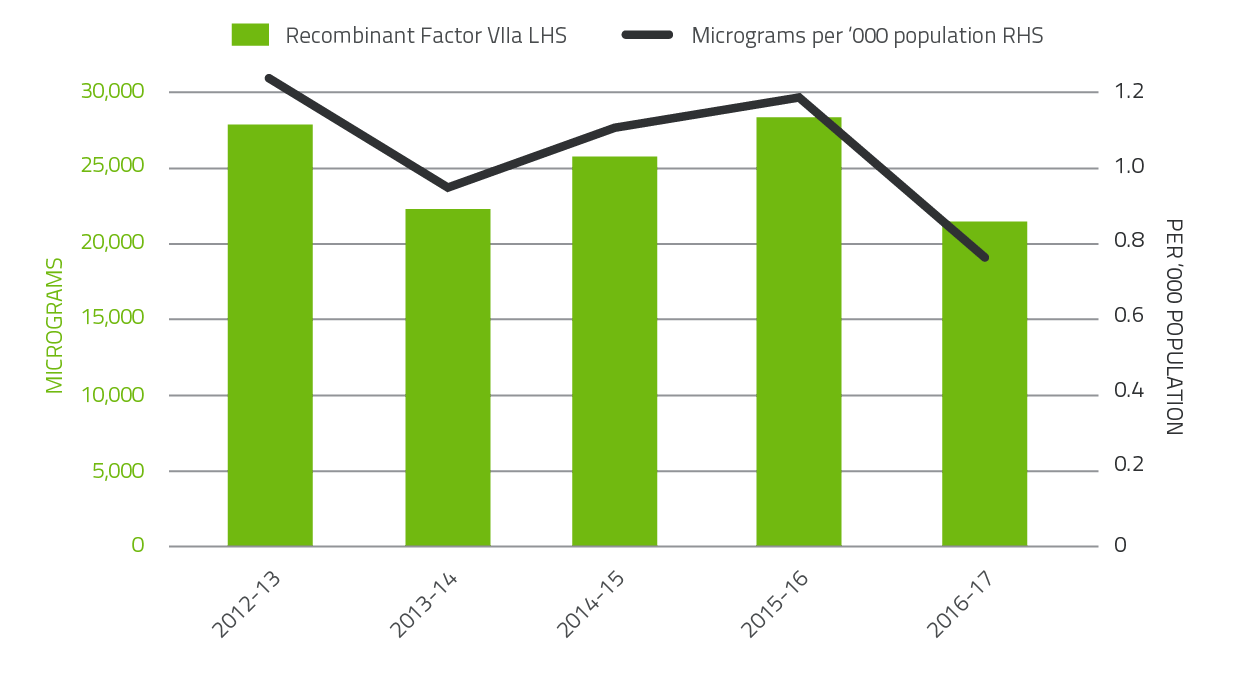
FIGURE 2.8 Issues of Factor VIIa products 2012-13 to 2016-17 per '000 population
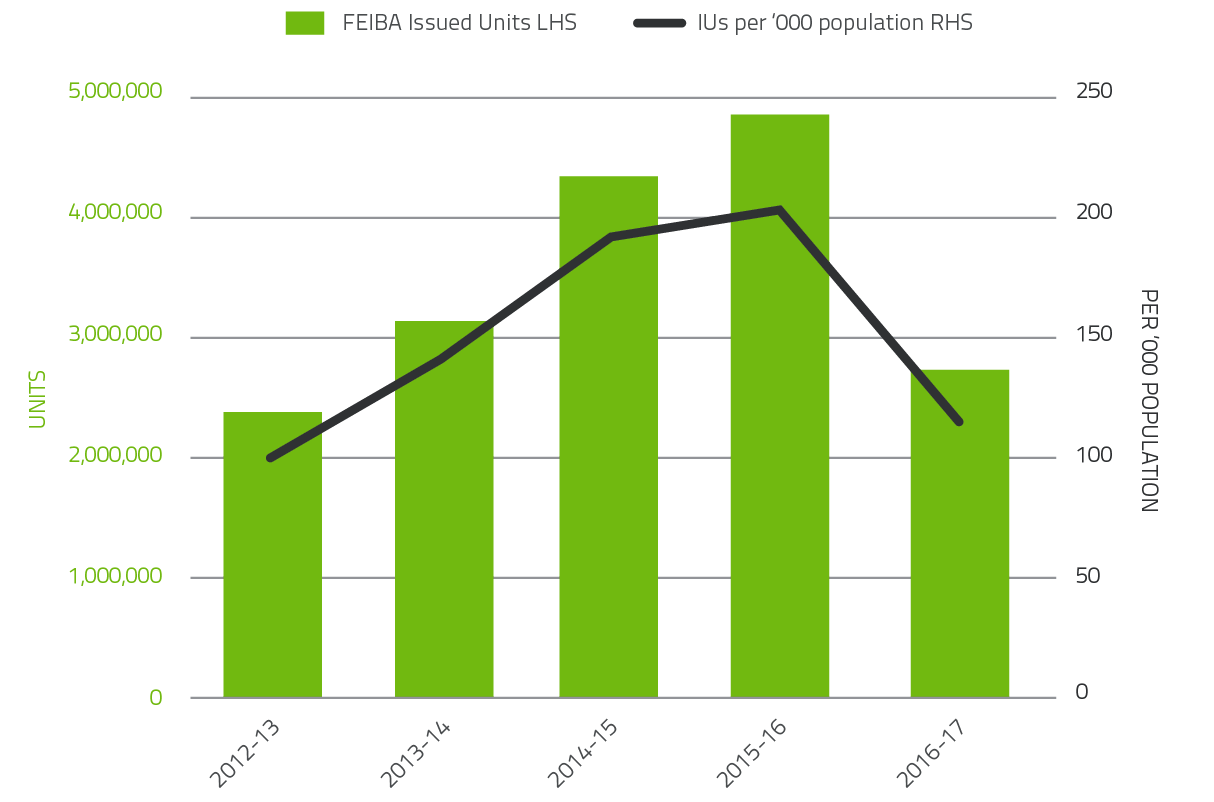
FIGURE 2.9 Issues of FEIBA, 2012-13 to 2016-17 per '000 population
Issues of immunoglobulin: Ig and Normal Immunoglobulin (NIg)
As shown below demand for Ig continues to grow at a consistent annual rate of more than 10 per cent.
|
2011-12 |
2012-13 |
2013-14 |
2014-15 |
2015-16 |
2016-17 |
|---|---|---|---|---|---|
|
10.9% |
10.7% |
11.0% |
10.2% |
12.4% |
11.2% |
In 2016-17, a total of 5.54 million grams of Ig was issued, representing a cost of $532.3 million nationally (including the cost of plasma collections). Of this amount, 56 per cent was Ig produced in Australia and 44 per cent was imported. Figure 2.10 highlights that the relative proportion of imported Ig compared to domestic Ig is growing at a rate of approximately five per cent per year over the last five years. This reflects the shortfall between the annual growth of domestic demand (approximately 11 per cent) and the annual growth of domestic plasma collection used to manufacture Ig (approximately 5 per cent).
The NBA produced an annual report of Ig usage in 2015-16, to document trends in Ig use and provide insights into the drivers of use at the micro level.
The Report on the Issue and Use of IVIg 2015-16 can be found on the NBA website at http://www.blood.gov.au/data-analysis-reporting.
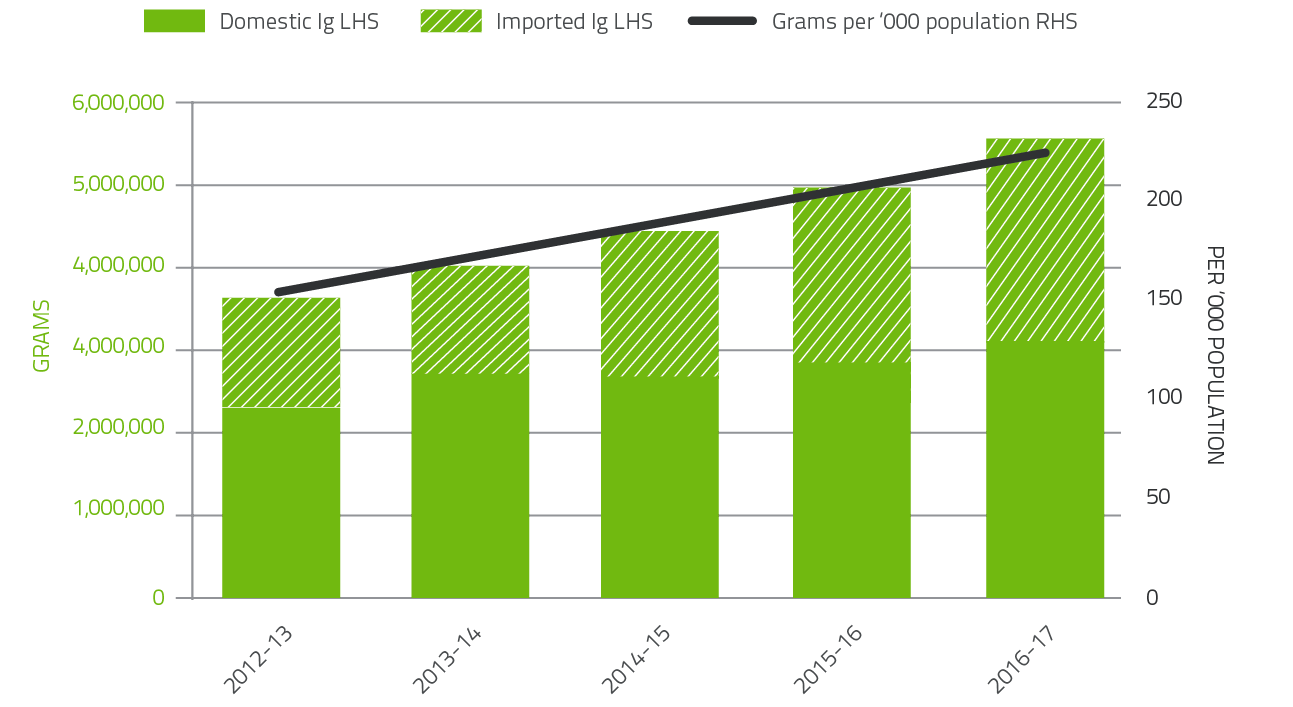
FIGURE 2.10 Issues of Ig products, 2012-13 to 2016-17 per '000 population
Contract Management
Maintaining security of supply requires the NBA to manage contracts with suppliers of blood and blood products. Contracts are developed in accordance with the Commonwealth Procurement Rules, and managed in accordance with Best Practice Guidance for contract management, including the guideline from the Australian National Audit Office (ANAO) on Developing and Managing Contracts.
In 2016-17, the NBA managed 14 blood and blood product supply contracts and arrangements.
The contracts managed by the NBA included:
- fresh blood product procurement - Australia's fresh blood component requirements through the Deed of Agreement with the Australian Red Cross Society
- plasma and recombinant product procurement - Australia's plasma product and recombinant product requirements through:
- the CSL Australian Fractionation Agreement (CAFA)
- contracts for the provision of imported IVIg, imported recombinant factors VIIa, VIII, IX, and XIII, and other imported plasma and recombinant products
- red cell diagnostic reagent products.
Deed of Agreement with the Australian Red Cross Society
The Deed of Agreement with the Australian Red Cross Society for the supply of fresh blood products by the Blood Service is one of the most important contracts managed by the NBA. The Blood Service is the sole supplier of fresh blood products. The provision of fresh blood products under the Deed is an essential clinical service that saves lives every day. The NBA has an ongoing program with the Blood Service to improve contract performance and accountability under the Deed. The NBA implemented a new nine year Deed of Agreement with the Australian Red Cross Society on 1 July 2016 and included a three year funding and service agreement.
Funding provided to the Blood Service is based on an OBFM arrangement. This was $582.4 million in 2016-17, a decrease of $6 million over the $588.4 million provided in 2015-16.
Performance
The performance of the Blood Service is a key element in meeting blood sector objectives. Governments expect the Blood Service to deliver effective services at optimum value for money. Governments outline their expectations of the Blood Service in relation to performance through the Deed of Agreement and the Blood Service Statement of Expectations. Blood Service performance against selected indicators is outlined in Table 2.3.
TABLE 2.3 Blood Service: selected key performance indicators, 2016-17
|
Domain |
Indicator |
2015-16 result* |
2016-17 Blood Service target |
2016-17 result* |
|
|---|---|---|---|---|---|
|
Donor management |
First time donors |
Whole Blood |
94,220 |
100,000 |
95,970 |
|
Apheresis Plasma |
46,619 |
52,000 |
45,142 |
||
|
Supply chain management |
Number of days within inventory bands (note: bands set by the Blood Service) |
339 |
N/A |
357 |
|
|
Red cell yield (proportion of collections covered to supply) |
91.6% |
91.5% |
91.3% |
||
|
Age of red cells at issue (days) |
6.85 |
8.0 |
6.94 |
||
|
Order fulfilment red cells |
98.0% |
N/A |
98.4% |
||
|
Quality and level |
Health provider satisfaction with Blood Service (mean score out of 10) |
8.8 |
8.9 |
9.1 |
|
|
Finance |
Main operating program financial result |
$47.4 million surplus |
>0 |
$27.3 million surplus |
|
*As measured by the Blood Service.
Implementing improvements to current arrangements
The NBA implemented a new Deed of Agreement with the Blood Service providing the legal framework for nine years which commenced on 1 July 2016, including the following:
- a funding and service agreement that includes the third cycle of the Output Based Funding Model (OBFM) for 2016-19
- the National Service Requirements and Standards that set out the Blood Service's relationships with health providers and the NBA. This includes business rules and standards for ordering, delivery, and receipt of products
NBA and Blood Service data and ICT systems security have been rigorously reviewed and upgraded in response to the Blood Service's potential data breach incident in 2016. The Blood Service has undertaken to action recommendations arising from various reviews of the incident, which the NBA will monitor in the coming year.
New technologies and processes will be trialled by the Blood Service with the aims of improving the efficiency of plasma collection and reducing costs, through the establishment of two pilot plasma only collection centres in Townsville and Canberra. The Townsville centre is due to open in September 2017, and the Canberra facility is expected to open in March 2018.
Blood Service research and development
Through a grant specified in the Deed of Agreement, the Blood Service received grant funding of approximately $9.1 million for its research and development program. The Blood Service and the NBA negotiated a new Research and Development (R&D) Framework under the new Deed of Agreement arrangements on 1 July 2016. In 2016-17, the Blood Service had five research strategic themes:
- donor behaviour
- donor health and wellbeing
- product development and storage
- product safety
- product usage.
R&D business outcomes for the Blood Service were on track with 100 per cent of research projects completed in 2016-17 being translated into changed business practices or learnings.
This year, R&D at the Blood Service was focussed on understanding what motivates current and future donors, the safety and quality of blood components, development of sensitive, specific and cost-effective testing capabilities, enhancement of knowledge of transfusible blood components and their interactions with patients, and improvement of practice. A strong emphasis is placed on translational research through close interaction between R&D and operational arms of the business through all stages of a research project's life cycle.
CSL Australian Fractionation Agreement (CAFA)
Most plasma derived products used in Australia are manufactured by CSL Behring (Australia) Pty Ltd under the CAFA from plasma collected by the Blood Service. CSL Behring (Australia) Pty Ltd is the sole manufacturer of plasma derived blood products in Australia and the NBA is responsible for negotiating and managing the CAFA.
In 2016-17, 637 tonnes of Australian plasma was pooled for fractionation under the CAFA, and expenditure on CAFA products totalled $269.6 million.
Performance
The 2016-17 performance by CSL Behring (Australia) Pty Ltd against the CSL Australian Fractionation Agreement (CAFA) Key Performance Indicators (KPIs) is shown in Table 2.4. This table reports actual performance. Sufficient supply of all products was maintained at all times. The performance of CSL Behring (Australia) Pty Ltd was within defined tolerances for each of the KPIs where known issues were beyond the control of CSL Behring (Australia) Pty Ltd, including the dynamics of supply, demand and production for some products, which affected CSL Behring (Australia) Pty Ltd's ability to meet KPI standards.
TABLE 2.4 CSL Behring (Australia) Pty Ltd's performance under the CAFA, 2016-17
|
Description of performance |
Results 2016-17 |
|||||
|---|---|---|---|---|---|---|
|
Q1 |
Q2 |
Q3 |
Q4 |
Annual |
||
|
KPI1 |
Plasma stewardship |
Achieved |
Achieved |
Achieved |
Achieved |
Achieved |
|
KPI2 |
Production yield |
4.884 g/kg |
4.921 g/kg |
4.724 g/kg |
4.566 g/kg |
4.774 g/kg |
|
KPI3 |
Management of required inventory levels |
|||||
|
Minimum starting plasma inventory |
Not active in 2016-17 |
|||||
|
Products in inventory |
100.00% |
98.85% |
100.00% |
100.00% |
99.71% |
|
|
Products in national reserve |
100.00% |
100.00% |
100.00% |
100.00% |
100.00% |
|
|
KPI4 |
Fulfilment of orders |
|||||
|
Orders by distributor (Blood Service) |
100.00% |
99.83% |
100.00% |
98.27% |
99.52% |
|
|
Orders by non-distributor |
97.96% |
100.00% |
100.00% |
100.00% |
99.49% |
|
|
KPI5 |
Shelf life of national reserve products |
97.92% |
100.00% |
91.67% |
100.00% |
97.40% |
Note: Values of less than 100 per cent but 90 per cent or more are considered to be achieved
Imported Ig
Ig is imported to meet a shortfall in domestic Ig production against clinical demand in Australia. In addition to supply under the national blood arrangements, the NBA also supports the purchasing of small amounts of imported Ig using jurisdictional direct orders.
Two contracts are in place for supply of imported Ig under the national blood arrangements. The contracts commenced from September 2015 and expire on 31 December 2018. The suppliers are CSL Behring (Australia) Pty Ltd and Grifols Australia. In 2016-17, the NBA expended $110.8 million for both contracts.
Performance
The 2016-17 performance of all suppliers against the contractual KPIs is shown in Table 2.5. Sufficient supply of products was maintained at all times in accordance with contractual requirements and was not affected by transient or administrative KPI deviations.
TABLE 2.5 Imported IVIg: Key performance indicators, by supplier, 2016-17
|
KPI |
Performance |
CSL Behring (Australia) Pty Ltd |
Grifols Australia Pty Ltd |
|---|---|---|---|
|
KPI1 |
In-country reserve |
Achieved |
Achieved* |
|
KPI2 |
Shelf life on |
Achieved* |
Not achieved |
|
KPI3 |
Delivery performance |
Achieved* |
Achieved* |
|
KPI4 |
Reporting accuracy and timeliness |
Achieved |
Achieved* |
*In these instances, the performance of the relevant supplier departed from the contracted requirement at some periods during the year and was managed by the NBA.
Imported plasma derived and recombinant blood products
The NBA has contracts with suppliers for the importation of selected plasma derived and recombinant blood products to augment domestic supply where these products are not produced in Australia or domestic production cannot meet demand.
In 2016-17, the NBA managed the supply contracts for imported plasma and recombinant products with the following four companies:
- Baxalta Australia Pty Ltd
- CSL Behring (Australia) Pty Ltd
- Novo Nordisk Pharmaceuticals Pty Ltd
- Pfizer Australia Pty Limited.
Procurement processes and contract negotiations were completed during 2016-17 for contracts for the supply of Protein C, Activated Prothrombin Complex Concentrate, Factor XIII, Anti-Rh (D) Ig, Fibrinogen Concentrate, C1 Esterase Inhibitor Concentrate and Factor XI Concentrate.
Expenditure on the above contracts in 2016-17 amounted to $119.5 million.
Performance
The 2016-17 performance of suppliers of imported plasma and recombinant blood products for each performance measure is shown in Table 2.6. All suppliers satisfactorily met required performance levels.
TABLE 2.6 Imported plasma and recombinant blood products: key performance indicators, by supplier, 2016-17
| KPI |
Performance measure |
Baxalta Australia Pty Ltd (FEIBA/CEPROTIN) |
Baxalta Australia Pty Ltd (ADVATE/RIXUBIS) |
CSL Behring |
CSL Behring |
Novo Nordisk |
Pfizer |
|---|---|---|---|---|---|---|---|
|
KPI1 |
In-country reserve |
Achieved |
Achieved |
Achieved |
Achieved |
Achieved |
Achieved |
|
KPI2 |
Shelf life on products delivered |
Achieved |
Achieved* |
Achieved |
Achieved |
Achieved* |
Achieved |
|
KPI3 |
Delivery performance |
Achieved* |
Achieved* |
Achieved* |
Achieved |
Achieved |
Achieved* |
|
KPI4 |
Reporting accuracy and timeliness |
Achieved |
Achieved* |
Achieved* |
Achieved |
Achieved* |
Achieved* |
*In these instances, the performance of the relevant supplier departed from the contracted requirement at some period during the year and was managed by the NBA.
Red cell diagnostic reagent products
Red cell diagnostic reagents are used for testing to establish the blood group of human red cells, detect red cell antibodies and to control, standardise and validate routine haematology tests.
The NBA has established a standing offer arrangement with the following four suppliers for the period 1 July 2016 to 30 June 2019:
- Bio-RAD Laboratories Pty Ltd
- Grifols Australia
- Ortho-Clinical Diagnostics (Johnson & Johnson Medical Pty Ltd)
- Seqirus Pty Ltd.
The standing offer lists more than 100 red cell diagnostic products, which are used in laboratory tests known as blood typing and cross matching. These tests ensure that when a person needs a blood transfusion, they receive blood that is compatible with their own.
Expenditure on diagnostic reagent supply is capped at $4.85 million per year. The NBA administers the cap for all jurisdictions and suppliers.