Trends in fresh blood product issues in Australia
In line with many developed countries Australia has made increasing progress towards improving the efficiency of blood utilisation and clinical transfusion practice. Transfusion-related clinical practice improvement programs in a number of states and territories have continued to develop in areas such as appropriate use of blood, clinical governance, haemovigilance and ongoing education of clinical and associated health care professionals.
Fresh blood products issued
The NBA coordinates the purchase and supply of blood and blood products on behalf of all Australian governments in accordance with government policies in the National Blood Agreement and National Blood Authority Act 2003.
In Australia, blood is voluntarily donated free from financial incentive. The Blood Service collects and processes blood and distributes blood products to Australian health providers. The Blood Service is funded by all Australian governments through the NBA which contracts the Blood Service under a Deed of Agreement.
The Therapeutic Goods Administration (TGA) regulates blood and plasma manufacturing activities and monitors any serious adverse transfusion events that may be product-related.
From 2011–12 to 2012–13, there were about 2.3 million components of fresh blood products issued in Australia. The demand for RBC remained high, accounting for about two-thirds of all issues. The demand for blood products varied across states and territories. NSW accounted for 32.5% of all issues, followed by VIC (25.4%) and QLD (21.2%). NT accounted for less than 1.0% of all issues.
| 2011–12 | RBC | Platelets | FFP | Cryoprecipitate | Cryodepleted plasma |
|---|---|---|---|---|---|
| Units | Units | Units | Units | Units | |
| NSW | 256,926 | 39,074 | 57,385 | 31,354 | 4,578 |
| VIC | 207,225 | 33,127 | 35,927 | 19,370 | 2,134 |
| QLD | 166,235 | 36,567 | 38,529 | 10,872 | 3,296 |
| WA | 65,742 | 9,356 | 9,944 | 7,654 | 815 |
| SA | 69,500 | 10,122 | 12,338 | 4,652 | 686 |
| TAS | 15,370 | 3,275 | 1,829 | 2,453 | 988 |
| ACT | 13,965 | 1,747 | 2,149 | 1,298 | 1,229 |
| NT | 6,333 | 882 | 923 | 446 | 30 |
| Australia | 801,295 | 134,149 | 159,024 | 78,099 | 13,756 |
| 2012–13 | RBC | Platelets | FFP | Cryoprecipitate | Cryodepleted plasma |
| Units | Units | Units | Units | Units | |
| NSW | 241,982 | 39,570 | 54,509 | 29,100 | 3,905 |
| VIC | 203,374 | 33,271 | 33,965 | 21,515 | 2,976 |
| QLD | 155,301 | 34,742 | 31,594 | 13,551 | 4,442 |
| WA | 64,064 | 10,200 | 9,450 | 10,618 | 2,390 |
| SA | 66,311 | 11,521 | 12,797 | 6,080 | 1,733 |
| TAS | 14,478 | 2,912 | 1,901 | 2,372 | 532 |
| ACT | 12,839 | 1,537 | 2,378 | 2,051 | 436 |
| NT | 5,194 | 824 | 1,047 | 405 | 261 |
| Australia | 763,542 | 134,576 | 147,641 | 85,692 | 16,675 |
Notes
- FFP=Fresh frozen plasma
- RBC=Red blood cell
- Totals may not add up due to rounding.
The following tables and figures show that:
- The demand for RBC declined by 4.7%, from 801,295 in 2011–12 to 763,542 in 2012–13. The issues of RBC per 1000 population also dropped from 35.6 per 1000 population in 2011–12 to 33.3 in 2012–13. The decline in RBC demand is likely to demonstrate initial successes in programs to improve appropriate use and reduce wastage.
- The platelet demand in 2012–13 was consistent with the demand in 2011–12 with only 0.3% growth. In contrast, the issues of platelets per 1000 population decreased slightly from 6.0% in 2010–11 to 5.9% in 2012–13. The constrained growth is again likely to be the result of the initial success of programs to improve appropriate use and reduce wastage.
- The demand for FFP decreased by 7.2% from 2011-12 to 2012-13.
- The demand for cryoprecipitate units rose steadily over the past four years to 2012–13. Cryoprecipitate is increasingly used in the treatment of massive bleeding and this may drive an increase in demand in the coming years.
- The demand for cryodepleted plasma units increased by 21.2%, from to 13,756 in 2010–11 to 16,675 in 2012–13 after a slight decrease between 2010–11 and 2011–12. It remains difficult to forecast the demand for this blood product because this product is used episodically in a very small number of patients with thrombotic thrombocytopenic purpura.
Declining demand for RBC was also reported by other countries including the United Kingdom (UK), New Zealand (NZ) and the Netherlands during similar periods.
- RBC issues declined by 5.5% from 2011 to 2013 in the UK.
- The transfusion rate for RBC decreased by 8.9% from 2010 to 2012 in NZ.
- A declining trend of about 7% in the number of distributed RBCs was seen in the Netherlands from 2010 to 2012.
| Fresh blood product | 2009–10 | 2010–11 | 2011–12 | 2012–13 |
|---|---|---|---|---|
| RBC | 795,892 | 800,570 | 801,295 | 763,542 |
| Platelets | 128,495 | 134,705 | 134,149 | 134,576 |
| Fresh frozen plasma | 160,813 | 160,537 | 159,024 | 147,641 |
| Cryoprecipitate | 64,734 | 70,102 | 78,099 | 85,692 |
| Cryodepleted plasma | 11,872 | 13,882 | 13,756 | 16,675 |
Note: RBC=Red blood cell
| Fresh blood product | 2009–10 | 2010–11 | 2011–12 | 2012–13 |
|---|---|---|---|---|
| RBC | 36.4 | 36.1 | 35.6 | 33.3 |
| Platelets | 5.9 | 6.1 | 6.0 | 5.9 |
| Fresh frozen plasma | 7.4 | 7.2 | 7.1 | 6.4 |
| Cryoprecipitate | 3.0 | 3.2 | 3.5 | 3.7 |
| Cryodepleted plasma | 0.5 | 0.6 | 0.6 | 0.7 |
Notes
- RBC=Red blood cell
- ABS population data[43] for December quarters 2009, 2010, 2011 and 2012 are used for the calculation of figures in this table.
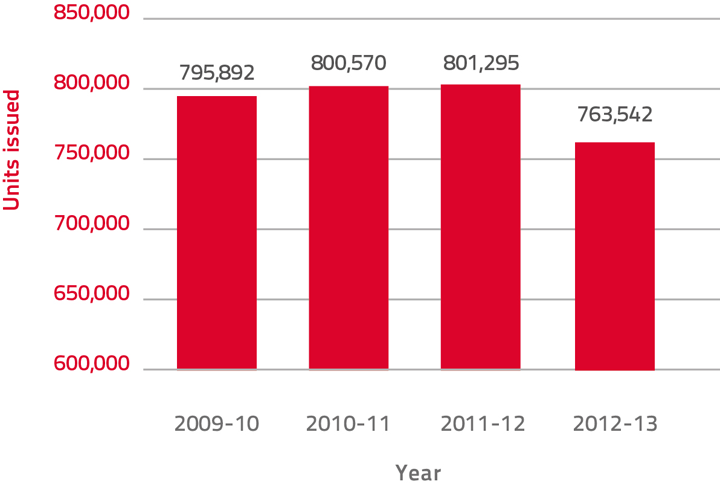
Figure 5: Total red blood cell issues in Australia, 2009–10 to 2012–13
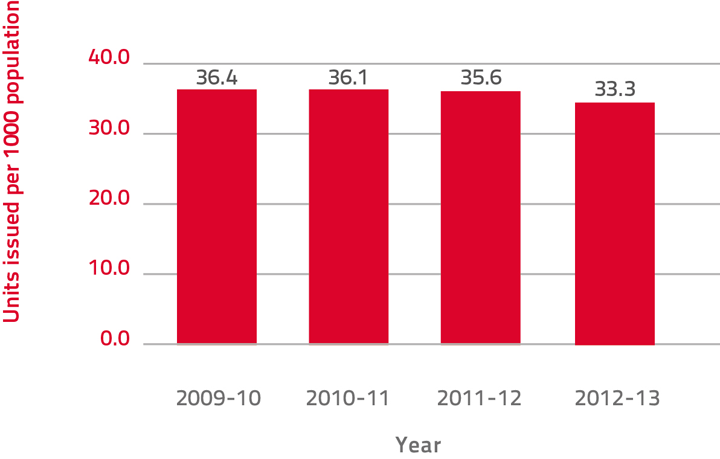
Figure 6: Total red blood cell issues per 1000 population, 2009–10 to 2012–13
Demographics of blood use
Australia's population grew by 1.8% to 23,130,900 during the year ended 30 June 2013. The growth rate has declined since the peak of 2.2% for the calendar year ended 31 December 2008.[44] Increases in population will inevitably result in increased future demand for health care services.
Australia's population, similar to that of most developed countries, is ageing as a result of sustained low birth rates and increasing life expectancy. This is resulting in proportionally fewer children (less than 15 years of age) in the population. The median age (the age at which half the population is older and half is younger) of the Australian population increased by 4.3 years over the last two decades, from 33.0 years at 30 June 1993 to 37.3 years at 30 June 2013. Between 30 June 2012 and 30 June 2013 the median age remained steady at 37.3 years. Over the next several decades, population ageing is projected to have significant implications for Australia in many spheres, including increased demands and spending on the health system.[45]
Australia enjoys one of the highest life expectancies in the world. In 2012 it was ranked sixth overall at 82.1 among Organisation for Economic Co‑operation and Development (OECD) countries after Japan (83.2 years), Iceland (83.0), Switzerland (82.8), Spain (82.5) and Italy (82.3).[46]
In the 12 months to 30 June 2013, the number of people aged 65 years and over in Australia increased by 120,100 people, representing a 3.7% increase. The proportion of the population aged 65 years and over increased from 11.6% to 14.4% between 30 June 1993 and 30 June 2013. This is projected to increase more rapidly over the next decade, as further cohorts of baby boomers turn 65. In the 12 months to 30 June 2013, the number of people aged 85 years and over increased by 19,300 (4.6%) to reach 439,600. Over the two decades to 30 June 2013, the number of people aged 85 years and over increased by 159% compared with a total population growth of 31% for the same period.[8]
The rise in the elderly population of Australia has a tangible effect on the nation's blood supply needs. There is a correlation between patient age and blood component use and this is illustrated by a range of data available from the Australian Institute of Health and Welfare (AIHW).
The AIHW publishes data relating to transfusion of blood and immunoglobulin on an annual basis. There are, however, a number of limitations[47] with respect to the analysis and the potential use of this data for blood supply demand planning:
- there is a 12 month delay before the data becomes available in the public domain
- information is only collected for patients who have been admitted to hospital
- information collected only relates to the number of transfusion procedures for blood and immunoglobulin. No information is collected regarding the actual number of units of blood components or plasma derived blood products transfused during each of these transfusion procedures
- other than for red blood cells, platelets and perhaps whole blood, the other sub‑coded data cannot be related to any specific blood component or plasma derived blood product such as 'coagulation factors', 'blood expanders', and 'other serum'
- differences in coding and reporting practices across hospitals and jurisdictions are likely to affect the quality of the data collected and may result in some under‑reporting.
Despite the limitations, the AIHW data provides some insight into Australian transfusion trends.
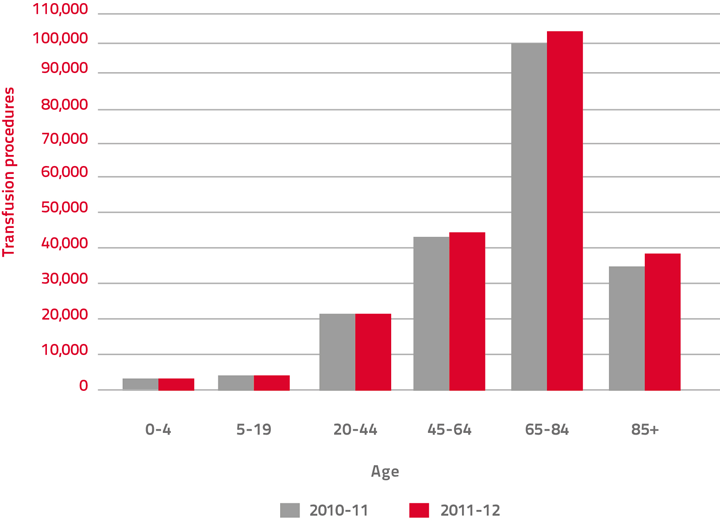
As shown in Figure 7 below, the majority of RBC transfusion procedures in 2010–11 and 2011–12 occurred in patients aged 65 years and over. A similar trend was also observed for other blood products (Table 37, Table 38) for the same period.
Source: AIHW National Hospital Morbidity Database
Figure 7: RBC transfusions by patient age, 2010–11 and 2011–12
This phenomenon is not unique to Australia. Epidemiological information from the United States, England, and Denmark highlighted similar age and sex distributions of transfused patients:[48]
- most of the red cell components were transfused to older recipients
- the distribution between men and women was approximately equal
- the distribution for platelets was over a wider age range
- the distribution for plasma was also directed to the elderly.
| Number of Procedures | Percentage of Procedures | |||||||||||
|---|---|---|---|---|---|---|---|---|---|---|---|---|
| Administration of | 0–4yrs | 5–19yrs | 20–44yrs | 45–64yrs | 65–84yrs | 85+ | 0–4yrs | 5–19yrs | 20–44yrs | 45–64yrs | 65–84yrs | 85+ |
| RBC | 4,539 | 5,208 | 21,234 | 43,994 | 100,789 | 33,064 | 2% | 2% | 10% | 21% | 48% | 16% |
| Platelets | 1,865 | 2,026 | 4,049 | 10,177 | 14,680 | 1,702 | 5% | 6% | 12% | 29% | 43% | 5% |
| Leukocytes | 9 | 12 | 12 | 46 | 36 | 3 | 8% | 10% | 10% | 39% | 31% | 3% |
| Autologous blood | 106 | 205 | 452 | 3,323 | 4,880 | 327 | 1% | 2% | 5% | 36% | 53% | 4% |
| Other serum | 2,182 | 1,349 | 6,009 | 15,679 | 21,732 | 3,794 | 4% | 3% | 12% | 31% | 43% | 7% |
| Blood expander | 10 | 13 | 310 | 728 | 1,084 | 232 | 0% | 1% | 13% | 31% | 46% | 10% |
| Other substance | 1,631 | 4,176 | 11,511 | 24,012 | 24,275 | 2,276 | 2% | 6% | 17% | 35% | 36% | 3% |
Note: ACHI=Australian Classification of Health Interventions
Source: AIHW National Hospital Morbidity Database
| Number of Procedures | Percentage of Procedures | |||||||||||
|---|---|---|---|---|---|---|---|---|---|---|---|---|
| Administration of | 0–4yrs | 5–19yrs | 20–44yrs | 45–64yrs | 65–84yrs | 85+ | 0–4yrs | 5–19yrs | 20–44yrs | 45–64yrs | 65–84yrs | 85+ |
| RBC | 4,678 | 5,373 | 21,522 | 44,808 | 104,535 | 35,157 | 2% | 2% | 10% | 21% | 48% | 16% |
| Platelets | 1,950 | 2,208 | 3,715 | 10,756 | 15,574 | 1,756 | 5% | 6% | 10% | 30% | 43% | 5% |
| Leukocytes | 8 | 10 | 14 | 32 | 24 | 1 | 9% | 11% | 16% | 36% | 27% | 1% |
| Autologous blood | 142 | 241 | 538 | 3,310 | 5,384 | 369 | 1% | 2% | 5% | 33% | 54% | 4% |
| Other serum | 2,325 | 1,535 | 6,161 | 16,564 | 23,011 | 4,039 | 4% | 3% | 11% | 31% | 43% | 8% |
| Blood expander | 11 | 15 | 314 | 473 | 827 | 174 | 1% | 1% | 17% | 26% | 46% | 10% |
| Other substance | 1,691 | 4,432 | 12,286 | 25,945 | 27,699 | 2,763 | 2% | 6% | 16% | 35% | 37% | 4% |
Note: ACHI=Australian Classification of Health Interventions
Source: AIHW National Hospital Morbidity Database
Clinical use of RBC
An Australian red cell linkage program examined red cell use in SA public hospitals.[49] The study showed a reduction in the surgical use of RBC from 2007 to 2009. About a third of RBC was used for surgical indications and half was used for medical indications in 2008–09. The most common medical indication was haematology, accounting for about one quarter of total RBC use.
The Blood Service 'Bloodhound' study[50] showed approximately one-third of tagged red blood cells were used to support surgery, one-third for haematology/oncology and one-third for other medical and miscellaneous indications. The breakdown of the clinical indications for transfusion was as follows:
- 33.6% for haematological and oncological conditions
- 27.8% for surgical specialities (including cardiothoracic 5.6%, orthopaedic 9.8%, vascular 2.3%, solid organ transplantation 2.3% and other 9.5%)
- 13.5% for other medical conditions (including gastroenterology 8.7%, nephrology 2.8%, paediatric specific indications 0.1% and other 1.9%)
- 12.7% for unspecified anaemia
- 3.8% for obstetrics and gynaecology
- 2.1% for trauma.
These Australian results are consistent with the similar studies undertaken by other countries. Tinegate et al[51] reported on surveys examining the changing patterns of red blood cell use in 1999, 2004 and 2009 in the North of England. The authors found that the surgical use of RBC also dropped significantly from 41% in 1999 to 29% in 2009, solely to the recipients aged 50 to 80 years. In contrast, the medical use of RBC (64% of RBC use in 2009) had not changed significantly over 10 years. The most common medical use of RBC was haematology, accounting for 28% of total RBC use in 2009.