Overview of reported serious transfusion‑related adverse events
Transfusion risks
Fresh blood components have become increasingly safe as a result of stringent donor screening and selection policies and increasingly sensitive and selective product testing in Australia. The infectious risks associated with transfusion are now very small. When considering the significance of specific risks, it is often useful to compare them to the risks associated with everyday living. The transfusion risk according to the Blood Service is high for allergic reaction, FNHTR and TACO; however it is very low for the other adverse events when compared to everyday risks (refer to Calman scale in Table 2 and transfusion risks in Table 3). For example, the chances of acquiring bacterial sepsis from a red cell transfusion are equivalent to the chances of death from a train accident according to the Calman chart risk per one year in Table 2.
| Risk Level | UK risk per one year |
|---|---|
| Negligible | < 1:1,000,000 such as death from a lightning strike |
| Minimal | 1:100,000–1:1,000,000 such as death from a train accident |
| Very low | 1:10,000–1:100,000 such as death from an accident at work |
| Low | 1:1,000–1:10,000 such as death from a road accident |
| High | > 1:1,000 such as transmission of chickenpox to susceptible household contacts |
| Adverse reactions | Risk per unit transfused (unless specified) | Calman rating |
|---|---|---|
| Allergic reaction | 1–3% of transfusions | High |
| Febrile non haemolytic reaction | 0.1–1% of transfusions with universal leucocyte depletion. Most frequently in patients previously alloimmunised by transfusion or pregnancy. | High |
| Transfusion‑associated circulatory overload | Up to 1% of patients receiving transfusions | High |
| Bacterial sepsis, relating to: | ||
| –Platelets | At least 1:75,000 | Very low |
| –Red cells | At least 1:500,000 | Minimal |
| Haemolytic reactions: | ||
| –Delayed | 1:2,500–1:11,000 | Low to very low |
| –Acute | 1:76,000 | Very low |
| –Fatal | less than 1:1 million | Negligible |
| Anaphylactic reaction | 1:20,000–1:50,000 | Very low |
| Transfusion-related acute lung injury | 1:1,200–1:190,000 | Low to minimal |
| Transfusion‑associated graft versus host disease | Rare | Negligible |
| Post‑transfusion purpura | Rare | Negligible |
Summary of main findings and results
This report details transfusion-related adverse events reported for 2011–12 and 2012–13. This summary section also reproduces data for 2008–09, 2009–10 and 2010–11 (from the previous Australian Haemovigilance Report) for comparative purposes.
Table 4 shows the number of adverse events reported (independent of assigned imputability) to the National Haemovigilance Program for the five financial years 2008–09 to 2012–13. The relative incidence of the adverse events is comparable to the data of many other developed countries, with a majority of febrile reactions and allergic reactions. DHTR, AHTR, TRALI, TTI and PTP all present with very low to minimal prevalence in patients. Human errors continue to contribute to adverse events (discussed further in the section on Contributory factors).
| Adverse event | 2008–09 | 2009–10 | 2010–11 | 2011–12 | 2012–13 | All reports | |
|---|---|---|---|---|---|---|---|
| Number | Per cent | ||||||
| FNHTR | 154 | 158 | 321 | 320 | 231 | 1,184 | 52.6% |
| Allergic reaction | 87 | 84 | 142 | 147 | 111 | 571 | 25.4% |
| IBCT | 22 | 23 | 30 | 62 | 43 | 180 | 8.0% |
| TACO | 6 | 12 | 24 | 27 | 17 | 86 | 3.8% |
| Anaphylactoid or anaphylactic reaction | 8 | 12 | 33 | 16 | 13 | 82 | 3.6% |
| TTI | 3 | 18 | 11 | 12 | 5 | 49 | 2.2% |
| DHTR | 4 | 8 | 10 | 17 | 6 | 45 | 2.0% |
| AHTR | 7 | 6 | 2 | 10 | 2 | 27 | 1.2% |
| TRALI | 3 | 8 | 8 | 4 | 1 | 24 | 1.1% |
| PTP | - | 2 | 1 | - | - | 3 | 0.1% |
| Total reports | 294 | 331 | 582 | 615 | 429 | 2,251 | 100.0% |
Notes
- All TTIs were bacterial infections and these were reported cases but not necessarily confirmed.
- Limited adverse event data available for NSW for 2008–09 and 2009–10. NSW only provided detailed data (such as blood products, outcome severity and imputability score) for 2011–12 and 2012–13.
- Adverse event data unavailable for ACT and NT for 2008–09, and QLD for 2012–13.
- Adverse event data unavailable for WA.
There were 2,251 reports of adverse events to the National Haemovigilance Program from 2008–09 to 2012–13 (Table 4). The improved reporting from NSW significantly contributed to the increase in the number of reports, from 294 in 2008–09 to 615 in 2011–12, however this dropped in 2012-13 to 429 due to QLD not providing any reports for that year. The most frequently reported adverse events are FNHTR and severe allergic reactions, representing 52.6% and 25.4% of all reports respectively. No PTP cases were reported for the collection period of this report. The Australian data for TACO, TRALI, and DHTR indicates that these adverse events are suspected to be under‑reported.
From 2008–09 to 2012–13, 2,019 reports specified the blood products involved (Figure 2). Blood product information is unknown for 23 reports and not provided for 209 reports which were all contributed by NSW for 2009–10 and 2010–11. Red blood cells were the products most often implicated in adverse events for the last three financial years, accounting for 71.9% of the reports (1,451 of 2,019). Only a very small proportion of adverse events were related to the transfusion of whole blood (rarely used in Australia), cryoprecipitate and cryodepleted plasma. WA and NSW (prior to 2011-12) are excluded from the analysis due to the unavailability of blood component data for these two states.
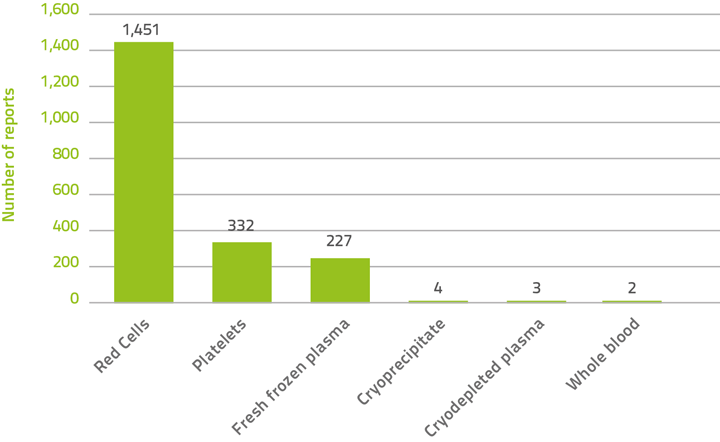
Figure 2: Blood products implicated in serious adverse events, 2008–09 to 2012–13
Notes:
- Blood product data unavailable for NSW from 2008–09 to 2010–11, ACT and NT for 2008–09, and QLD for 2012–13.
- Blood product data unavailable for WA.
- Unknown products excluded from analysis.
Table 5 details the numbers of adverse events by blood product reported for 2008–09 to 2012–13. Table 6 details the Clinical outcome severity data reported by adverse events for 2008–09 to 2012–13.
Two cases of death (TACO and allergic reaction) were reported to National Haemovigilance Program in 2008–09. The number of adverse events reported with life threatening severity also dropped, from a total of 30 in 2008–09 to 10 in 2011–12 and 4 in 2012–13. Improved transfusion practice and better management of adverse events may contribute to the reduction of reported deaths and life threatening cases in Australia. In contrast, the cases with severe morbidity rose from 11 in 2008–09 to 55 in 2011–12 due to the increased reporting for most adverse events, but dropped to 42 in 2012–13 due to the unavailability of QLD data. The cases with minor morbidity had an increase from 33 in 2008–09 to 471 in 2011–12, most likely due to increased awareness of collecting and reporting non-serious adverse events such as FNHTRs and minor allergic reactions; and then dropped to 323 in 2012–13 due to the unavailability of QLD data.
| Adverse event/year |
Whole blood | Red blood cells | Platelets | Fresh frozen plasma |
Cryodepleted plasma |
Cryoprecipitate | Unknown | Total |
|---|---|---|---|---|---|---|---|---|
| FNHTR | ||||||||
| 2008–09 | - | 134 | 15 | 2 | - | - | 3 | 154 |
| 2009–10 | - | 143 | 14 | 1 | - | - | - | 158 |
| 2010–11 | - | 170 | 27 | 3 | - | - | 121 | 321 |
| 2011–12 | - | 294 | 26 | - | - | - | - | 320 |
| 2012–13 | 1 | 201 | 24 | 5 | - | - | - | 231 |
| Allergic reaction | ||||||||
| 2008–09 | - | 40 | 19 | 27 | - | 1 | - | 87 |
| 2009–10 | - | 30 | 27 | 25 | 1 | 1 | - | 84 |
| 2010–11 | - | 33 | 27 | 41 | 1 | - | 40 | 142 |
| 2011–12 | - | 56 | 54 | 36 | - | 1 | - | 147 |
| 2012–13 | - | 42 | 35 | 34 | - | - | - | 111 |
| IBCT | ||||||||
| 2008–09 | - | 14 | 1 | 3 | - | - | 4 | 22 |
| 2009–10 | 1 | 16 | 5 | - | - | - | 1 | 23 |
| 2010–11 | - | 18 | 4 | 3 | - | - | 5 | 30 |
| 2011–12 | - | 49 | 2 | 10 | 1 | - | - | 62 |
| 2012–13 | - | 28 | 9 | 6 | - | - | - | 43 |
| Anaphylactic | ||||||||
| 2008–09 | - | 1 | 2 | 2 | 1 | - | 2 | 8 |
| 2009–10 | - | 5 | 1 | 1 | - | - | 5 | 12 |
| 2010–11 | - | 13 | 3 | 9 | - | - | 8 | 33 |
| 2011–12 | - | 6 | 5 | 5 | - | - | - | 16 |
| 2012–13 | - | 5 | 4 | 4 | - | - | - | 13 |
| TACO | ||||||||
| 2008–09 | - | 2 | - | 1 | - | - | 3 | 6 |
| 2009–10 | - | 8 | - | - | - | - | 4 | 12 |
| 2010–11 | - | 10 | - | 4 | - | - | 10 | 24 |
| 2011–12 | - | 25 | 1 | 1 | - | - | - | 27 |
| 2012–13 | - | 17 | - | - | - | - | - | 17 |
| DHTR | ||||||||
| 2008–09 | - | 1 | 3 | - | - | - | - | 4 |
| 2009–10 | - | 8 | - | - | - | - | - | 8 |
| 2010–11 | - | 6 | - | 1 | - | - | 3 | 10 |
| 2011–12 | - | 16 | 1 | - | - | - | - | 17 |
| 2012–13 | - | 6 | - | - | - | - | - | 6 |
| Bacterial TTI | ||||||||
| 2008–09 | - | 1 | 1 | - | - | - | 1 | 3 |
| 2009–10 | - | 2 | 5 | - | - | - | 11 | 18 |
| 2010–11 | - | 4 | 5 | - | - | - | 2 | 11 |
| 2011–12 | - | 6 | 6 | - | - | - | - | 12 |
| 2012–13 | - | 2 | 3 | - | - | - | - | 5 |
| TRALI | ||||||||
| 2008–09 | - | 1 | - | 1 | - | - | 1 | 3 |
| 2009–10 | - | 2 | 1 | 2 | - | - | 3 | 8 |
| 2010–11 | - | 5 | - | - | - | - | 3 | 8 |
| 2011–12 | - | 2 | 2 | - | - | - | - | 4 |
| 2012–13 | - | 1 | - | - | - | - | - | 1 |
| AHTR | ||||||||
| 2008–09 | - | 7 | - | - | - | - | - | 7 |
| 2009–10 | - | 6 | - | - | - | - | - | 6 |
| 2010–11 | - | 1 | - | - | - | - | 1 | 2 |
| 2011–12 | - | 10 | - | - | - | - | - | 10 |
| 2012–13 | - | 2 | - | - | - | - | - | 2 |
| PTP | ||||||||
| 2009–10 | - | 2 | - | - | - | - | - | 2 |
| 2010–11 | - | - | - | - | - | - | 1 | 1 |
| Total | 2 | 1,451 | 332 | 227 | 4 | 3 | 232 | 2,251 |
Notes
- Blood product data unavailable for WA.
- Blood product data unavailable for ACT and NT for 2008–09, NSW from 2008–09 to 2010–11, and QLD for 2012–13.
| FNHTR | Allergic reaction | IBCT | Anaphylactic | TACO | DHTR | Bacterial TTI | AHTR | TRALI | PTP | Total | |
|---|---|---|---|---|---|---|---|---|---|---|---|
| Death | |||||||||||
| 2008–09 | - | 1 | - | - | 1 | - | - | - | - | - | 2 |
| 2009–10 | - | - | - | - | - | - | - | - | - | - | - |
| 2010–11 | - | - | - | - | - | - | - | - | - | - | - |
| 2011–12 | - | - | - | - | - | - | - | - | - | - | - |
| 2012–13 | - | - | - | - | - | - | - | - | - | - | - |
| Life threatening | |||||||||||
| 2008–09 | 5 | 16 | 1 | 3 | - | - | 1 | 2 | 2 | - | 30 |
| 2009–10 | - | 1 | - | 2 | - | 1 | - | - | 1 | - | 5 |
| 2010–11 | - | - | 1 | 1 | 1 | - | 1 | - | - | - | 4 |
| 2011–12 | 1 | 2 | - | 3 | 3 | - | - | 1 | - | - | 10 |
| 2012–13 | - | - | 1 | 3 | - | - | - | - | - | - | 4 |
| Severe morbidity | |||||||||||
| 2008–09 | 3 | 8 | - | - | - | - | - | - | - | - | 11 |
| 2009–10 | 6 | 4 | 2 | 4 | 3 | 3 | 1 | 5 | 2 | 1 | 31 |
| 2010–11 | 12 | 9 | 2 | 6 | 9 | 1 | 2 | 1 | 3 | - | 45 |
| 2011–12 | 8 | 13 | 5 | 5 | 13 | 7 | - | 3 | 1 | - | 55 |
| 2012–13 | 12 | 10 | 4 | 5 | 9 | 1 | 1 | - | - | - | 42 |
| Minor morbidity | |||||||||||
| 2008–09 | 14 | 16 | 2 | 1 | - | - | - | - | - | - | 33 |
| 2009–10 | 122 | 58 | 13 | 1 | 5 | 4 | 2 | 1 | 1 | 1 | 208 |
| 2010–11 | 184 | 87 | 8 | 15 | 4 | 5 | 3 | - | 2 | - | 308 |
| 2011–12 | 306 | 128 | 2 | 7 | 10 | 9 | 1 | 6 | 2 | - | 471 |
| 2012–13 | 202 | 96 | 7 | 5 | 8 | 1 | 1 | 2 | 1 | - | 323 |
| No morbidity | |||||||||||
| 2008–09 | 77 | 29 | 17 | 3 | 1 | 4 | 1 | 4 | - | - | 136 |
| 2009–10 | 29 | 21 | 8 | - | - | - | 4 | - | 1 | - | 63 |
| 2010–11 | 9 | 7 | 14 | 2 | - | 1 | 3 | - | - | - | 36 |
| 2011–12 | 4 | 4 | 24 | 1 | - | 1 | 7 | - | - | - | 41 |
| 2012–13 | 9 | 5 | 16 | - | - | 2 | - | - | - | - | 32 |
| Outcome not available | |||||||||||
| 2008–09 | 55 | 17 | 2 | 1 | 4 | - | 1 | 1 | 1 | - | 82 |
| 2009–10 | 1 | - | 0 | 5 | 4 | - | 11 | - | 3 | 0 | 24 |
| 2010–11 | 116 | 39 | 5 | 9 | 10 | 3 | 2 | 1 | 3 | 1 | 189 |
| 2011–12 | 1 | - | 31 | - | 1 | - | 4 | - | 1 | - | 38 |
| 2012–13 | 8 | - | 15 | - | - | 2 | 3 | - | - | - | 28 |
| Total | 1,184 | 571 | 180 | 82 | 86 | 45 | 49 | 27 | 24 | 3 | 2,251 |
Notes
- Clinical outcome severity data unavailable for ACT and NT for 2008–09, NSW from 2008–09 to 2010–11, and QLD for 2012–13.
- Clinical outcome severity data unavailable for WA.