
In 2008–09 the NBA managed 13 blood supply contracts and arrangements. No new contracts were entered into during the year, but four contracts were subject to variation and extension. Optimal NBA performance in this key strategic area is essential to ensuring continued value for money and affordability of the blood supply. Activities included:
The Australian Red Cross Blood Service collects fresh blood from voluntary donors in order to produce a variety of blood components that are used for the treatment of medical conditions such as cancer, heart disease, stomach and bowel disease and liver and kidney disease, as well as to treat newborn babies and pregnant women. Donated blood is also used to help people who suffer from traumatic incidents such as accidents and burns and during or as a result of surgery. The ARCBS also collects plasma, which is provided to CSL Ltd for fractionation into a variety of products that are then purchased through the NBA contract with CSL.
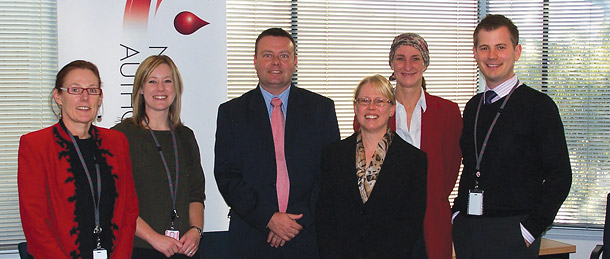
The NBA and ARCBS contract management teams.
The NBA manages the relationship with the ARCBS—the sole supplier of fresh blood-related products in Australia—and is responsible for negotiating and managing the ARCBS Deed of Agreement. The NBA also manages a number of projects involving the ARCBS and provides secretariat and project management support for the National Managed Fund.
Funding for the ARCBS increased from actual funding of $369.1 million in 2007–08 to an agreed budget of $417.2 million in 2008–09 (see Table 2.5).
| Year | Amount ($m) | % growth |
|---|---|---|
| 2003–04 | 247.8 | … |
| 2004–05 | 277.0 | 11.8 |
| 2005–06 | 297.7 | 7.5 |
| 2006–07 | 327.1 | 9.9 |
| 2007–08 | 369.1 | 12.8a |
| 2008–09 | 417.2 | 13.0 |
| Total | 1935.9 | 11 (average) |
a: This figure differs from that presented in the 2007–08 annual report due to adjustments made after receipt of the ARCBS final reconciliation.
The growth in funding reflects increased demand (see Figure 2.3) and changes in the product mix for fresh blood components. For example, Figure 2.7 shows the continued decline in demand for red cells derived from whole blood and the progressive implementation of 100 per cent leucodepleted red cells. Figure 2.8 shows that the total number of red cells issued per 1000 population increased from 2007–08 to 2008–09. The drop in 2007–08 was, however, mainly due to a 6 per cent decrease in demand in New South Wales in response to a range of measures the state government introduced to improve accountability and management focus at the area health service level.
FIGURE 2.7 Product mix of red cells issued by the Australian Red Cross Blood Service 2003–04 to 2008–09
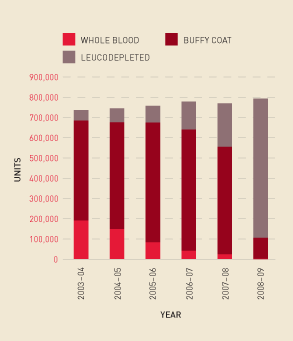
FIGURE 2.8 Red cells issued per 1000 head of population, 2003–04 to 2008–09
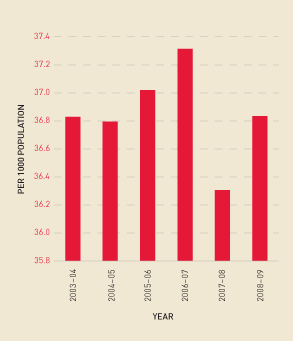
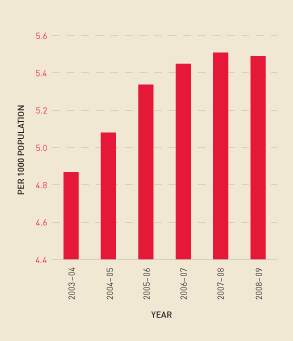
Figure 2.9 shows the change in demand for platelets derived from whole blood donations compared with those derived from apheresis processes. Figure 2.10 shows that the rate of growth in platelet issues per 1000 head of population remained relatively stable from 2006–07 to 2008–09.
FIGURE 2.9 Product mix of platelets issued by the Australian Red Cross Blood Service, 2003–04 to 2008–09
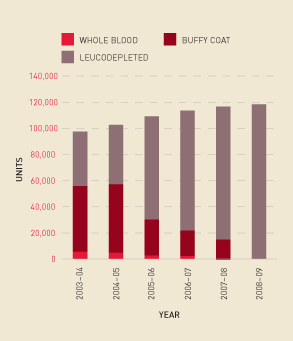
FIGURE 2.10 Platelets issued per 1000 head of population, 2003–04 to 2008–09
The current ARCBS Deed of Agreement was due to expire on 1 July 2009. Several of the current Deed’s requirements are not yet finalised, and a number of the recommendations of the business study have implications for the next Deed, including the development and implementation of an output-based funding model. In light of these considerations, the NBA and the ARCBS agreed to extend the existing Deed, with several variations, by 12 months until 30 June 2010. The variations, incorporated at the request of jurisdictions in the interest of increased efficiencies, include changes to the funding formula, extension of the Change Program Funding arrangements for a further 12 months, and revisions to key performance indicators to increase clarity.
The next Deed will be negotiated once the development of an output-based funding model has been agreed by the ARCBS and governments. It will also be informed by the outcomes of the review of distribution arrangements and the new CSL Domestic Fractionation Agreement.
On 22 July 2008 the Australian Health Ministers Conference agreed on the combined government response and implementation strategy for the recommendations of the ARCBS business study. Ministers also agreed that the Minister for Health and Ageing write to the Australian Red Cross Society (ARCS) and ARCBS Boards, advising of governments’ response to the business study and establishing ministers’ expectations of the ARCBS. The Australian Health Ministers Conference directed the Jurisdictional Blood Committee to present a progress report in 2009 on the implementation of agreed recommendations.
The ARCS and ARCBS Boards have confirmed their commitment to implementing the business study recommendations, which cover a range of areas in five domains:
The first scorecard report to the Australian Health Ministers Conference on the status of implementation of the business study recommendations is to be provided in September 2009. Progress on improvements recommended in the business study has been sound, with 32 per cent of the recommendations now fully implemented. Current progress on two major areas of work—the output-based funding model and the planning framework—are described in the following paragraphs.
Governments have agreed to fund the ARCBS through a three-year output-based model starting from 2010–11. This means that the ARCBS will be paid for products issued, which will result in a greater alignment of supply to demand. Work has begun in developing five interrelated aspects:
The recommendations of the business study gave renewed impetus to the original Deed of Agreement objective of integrated long-term planning. This objective was progressed through planning forums in August 2008 and May 2009 that have:
The ARCBS Strategic Capital Investment Plan details the intended capital expenditure required to sustain fixed assets, including replacement of assets such as vehicles, laboratory equipment and premises (for example, refurbishments, relocations and new sites). The Plan, covering a three-year period, is prepared by the ARCBS annually and submitted to the Jurisdictional Blood Committee as part of the approval process for the National Supply Plan and Budget.
Under the Deed of Agreement the annual capital funding provided to the ARCBS covers 10 per cent of the service’s main operating program. For 2008–09 this represented $38 million. Table 2.6 shows the value of the approved annual capital plans from 2006–07 to 2008–09.
| 2006–07 | 2007–08 | 2008–09 |
|---|---|---|
| $29.58 million | $32.96 million | $38.00 million |
In addition to the approved annual capital plans, governments have agreed to fund, as appropriate, the redevelopment of the principal manufacturing sites in NSW and Victoria in order to update and expand the capacity of the ARCBS.
In April 2008 the Australian Health Ministers Conference gave policy approval for additional funding for the ARCBS to meet building leases and fit-out for a new principal blood-manufacturing site for New South Wales and the Australian Capital Territory.
The three-storey facility will be located at Green Square, a suburb between the Sydney CBD and Kingsford-Smith Airport. Construction began in late June 2009 and is expected to be completed by mid-2010. When complete in 2010, the development will comprise 12 450 square metres of purpose-built manufacturing space, at a cost of about $188 million. The new facility will be responsible for the processing and distribution of all blood and blood components in New South Wales and the Australian Capital Territory.
In December 2008 health ministers approved in-principle additional funding for the ARCBS over 20 years to meet the costs of building and outfitting leases for a new principal blood-manufacturing site in Melbourne. The ARCBS subsequently undertook an extensive tender process to identify the optimum relocation site, based on the then requirement from government that the property be occupied by way of a 20-year lease with two 5-year option periods.
Responding to the in-principle approval of funding, by May 2009 the ARCBS had brought the required contractual elements for this development close to finalisation pending final policy and indemnities approval by health ministers.
On 12 May 2009 the Treasurer announced in the 2009–10 Federal Budget that the ARCBS would receive $120 million (allocated as capital over two years) for the Victoria and Tasmania principal site development, to be provided through the Health and Hospitals Fund, and that this would require the jurisdictions to fund the remainder of the project costs. The change in the nature of the funding, while offering cost savings to governments in the long term, has required the NBA, the ARCBS, the Health and Hospitals Fund, the likely developer and the jurisdictions to rapidly develop alternative arrangements to meet the ARCBS’s timetable.
The new facility, to be located in Melbourne, will accommodate the ARCBS’s blood-manufacturing operations for Victoria and Tasmania. It will contribute 25–30 per cent of Australia’s fresh blood supply. Building works are expected to commence in mid-August 2009, and the facility is expected to be operational by September 2011.
A key component of the ARCBS’s Annual Capital Plan and 2009–14 Strategic Capital Investment Plan was the inclusion of $14 million in investment across three years to replace the current National Blood Management System. Other programs supported during the 2008–09 included:
Quarterly meetings between the Chief Executive Officerss and Chief Financial Officerss continued during the reporting year, with a clear focus on improving overall governance and ensuring progress against agreed performance targets. While acknowledging the operational effectiveness of these meetings, the business study recommended increased engagement at the board level to drive a higher level of accountability and a tighter focus on governance and strategic longer term performance. This engagement is discussed by the Chair of the NBA Board in his report.
The NBA reached agreement with the ARCBS to implement the first of the third-party reviews required under the Deed of Agreement. This review was designed to analyse the extent to which the ARCBS complies with Governance Standard AS 8000–2003 Good Governance Principles and the extent to which this has resulted in and continues to provide good governance within the ARCBS.

Fresh blood relationship manager Mr Andrew Mead
The review, conducted in February–March 2009, found that the ARCBS demonstrated a high level of commitment to effective governance against the standards, although some opportunities for further development were identified—in particular, the benefit of establishing new simplified outcome-based and control system status reporting to the NBA. At the May CEOs meeting it was agreed that this should become one of the objectives of the new Deed.
Development of approaches for increasing donor retention rates and increasing the number of donations per donor are priorities required by government. The ARCBS exceeded its planned parameter of 536 307 whole blood donors, with a total of 541 848 such donors in 2008–09. Apheresis plasma and platelet donors were under plan, by 1.95 per cent and 4.7 per cent respectively. Nevertheless, these donor panels continue to grow slowly but steadily.
The proportion of new donors in the total donor panel continued to increase after the surge in the third quarter that reflected the overwhelming public response to the Victorian bushfires, in addition to increased public awareness through the Year of the Blood Donor.
There was a corresponding increase in product inventory, as well as a shift in the proportion of new donors in the panel.
In 2008–09 process-related recall incidents occurring after the supply of product were significantly below the planning parameter of 0.65 per 10 000 collections.
Whole blood collection conversion to supply fell below the 2008–09 target by 2.4 per cent. ARCBS explained that this shortfall was due to implementation of the new edition of the Council of Europe Guide to the preparation, use and quality assurance of blood components, with red cells not suitable for clinical use and an increased discarding of red cells following the introduction of 100 per cent screening for bacterial contamination.
The actual supply of fresh blood products for 2008–09 compared with the annual supply estimates agreed by the Australian Health Ministers Conference (including the move to 100 per cent leucodepletion in 2008–09) is highlighted in Table 2.7.
| Variance to NSP&B Volume | Volume % Var | ||
|---|---|---|---|
| Total Red Cells | Units | 5 280 | 0.7% |
| Total Platelets | Units | (2 902) | -2.4% |
| Total Clinical Fresh Frozen Plasma | Units | (856) | -0.6% |
| Plasma for Fractionation | Kgs | 10 207 | 2.7% |
The quantity of plasma for fractionation was 2.7 per cent over the annual supply requirement. The increase in collections of plasma in 2008–09 followed implementation of the new Council of Europe guidelines, in which the total average plasma collection allowable from each apheresis donation was increased.
Leucodepletion of red cells throughout Australia was achieved in October 2008, and significant savings are being realised through the standardisation of blood bags that was undertaken at the same time.
The National Managed Fund is designed to cover future liability claims made against the ARCBS in relation to the supply of blood and blood-related products in Australia. Sound progress on administrative and governance arrangements was achieved in 2008–09.
The Deed of Agreement acknowledges that the ARCBS might have to seek additional government assistance in order to implement reforms. Several business cases requesting such assistance were assessed during the reporting year. The ARCBS continued to use funding approved by the Jurisdictional Blood Committee to address the impact on the blood supply of new requirements under the new edition of the Council of Europe guidelines. In particular, the provisions in relation to the management of donors with a history of malaria, acupuncture and body piercing were updated.
Twelve projects costing $7 million in total have now been funded under the Change Program to help the ARCBS transition to a national operation, to deliver cost savings, or to otherwise increase the efficiency of the production of goods and services under the Deed of Agreement. Table 2.8 summarises the nature of these projects and their status.
In line with the extension of the Deed of Agreement, the Jurisdictional Blood Committee approved the extension of Change Program funding for a further year, to 30 June 2010.
| Project | Approved budget ($m) | Status |
|---|---|---|
| Deed transition program—phases 2 & 3 | $0.9 | In progress |
| Third party reviews | $0.2 | In progress |
| Deed operations initiative | $0.1 | Complete |
| Product costings and forecasting—phase 2 | $0.6 | In progress |
| Finance Deed transition | $0.1 | Complete |
| Asset management | $0.7 | In progress |
| Governance standards implementation | $0.3 | In progress |
| Handover plan | $0.5 | In progress |
| Corporate information management and reporting—release 1 | $0.6 | Complete |
| Automated budget | $0.6 | In progress |
| Workforce planning | $1.6 | In progress |
| Learning project | $0.7 | In progress |
The NBA is responsible for negotiating and managing contracts and standing offers with commercial suppliers of blood and blood-related products. These contracts relate to the supply of:
In Australia, CSL Ltd fractionates plasma collected by the ARCBS to produce products to meet the needs of the Australian health sector. Plasma fractionation arrangements are governed by the Plasma Products Agreement between the NBA and CSL Ltd; the Agreement covers pricing, invoicing, supply planning and monitoring, risk management, and ordering and delivery.
Funding to CSL Ltd for the Plasma Products Agreement increased from $155.9 million in 2007–08 to $158.1 million in 2008–09 (see Table 2.9).
| Year | Amount ($m) | % growth |
|---|---|---|
| 2003–04 | 141.2 | … |
| 2004–05 | 138.5 | –1.9 |
| 2005–06 | 133.0 | –3.9 |
| 2006–07 | 141.3 | 6.2 |
| 2007–08 | 155.9 | 10.3 |
| 2008–09 | 158.1 | 1.4 |
| Total | 868.0 | 2.4 (average) |
CSL Ltd achieved all of the key performance indicators specified in the agreement (see Table 2.10).
| Key performance indicator | Achievement |
|---|---|
| Yield of Group 1 products | 5.26 g IVIg per kilogram starting plasma |
| Loss of Group 2 plasma or Group 2 finished products | 0.04% |
| Fulfilment of orders | 99.5% |
The current Agreement with CSL Ltd expires on 31 December 2009. The NBA has implemented a comprehensive project to negotiate a new agreement with CSL Ltd that will continue to deliver improved value for money for government. The approach has been informed by feedback from key stakeholders through a discussion paper that sought comment on a range of subjects relating to the adequacy of the current Agreement. Issues raised through this process have been further refined in expert workshops and bilateral consultations. The Jurisdictional Blood Committee has provided policy guidance for the new Agreement and the NBA expects that the new Agreement will be in place by January 2010.
Imported plasma-derived and recombinant blood products The NBA has established a range of contracts with overseas suppliers for the importation of selected plasma-derived and recombinant blood products to augment domestic supply and obtain products that cannot be manufactured in Australia, either because the technical capacity is not available or because it is not economically viable to do so. Since 2006 the NBA has managed contracts with Baxter Healthcare Pty Ltd, Wyeth Australia Pty Ltd and Novo Nordisk Pharmaceuticals Pty Ltd. In 2008–09 the NBA spent $150.1 million under these contracts for the supply of imported blood products (see Table 2.11).
| Year | Baxter | Wyeth | Novo Nordisk | |||
|---|---|---|---|---|---|---|
| Amount ($m) | % growth | Amount ($m) | % growth | Amount ($m) | % growth | |
| 2003–04 | $32.2 | $5.5 | $14.6 | |||
| 2004–05 | $54.5 | 69.4 | $10.9 | 96.5 | $18.8 | 28.6 |
| 2005–06 | $69.9 | 28.2 | $15.9 | 45.5 | $23.4 | 24.5 |
| 2006–07 | $71.5 | 2.3 | $33.8 | 45.5 | $26.9 | 15.3 |
| 2007–08 | $80.1 | 12.0 | $42.4 | 25.3 | $17.4 | –35.3 |
| 2008–09 | $84.1 | 5.0 | $48.6 | 14.8 | $17.4 | –0.2 |
| Total | $392.3 | 23.4 (avg.) | $157.1 | 59.1 (avg.) | $118.5 | 6.6 (avg.) |
A high degree of performance against contractual key performance indicators was again demonstrated in 2008–09 (see Table 2.12).
| Key performance indicators | Baxter | Wyeth | Novo Nordisk |
|---|---|---|---|
| Delivery performance | Achieved | Achieved | Achieved |
| In-country reserve | Achieved | Achieved | Achieved |
| Ordering | Achieved | Achieved | Achieved |
| Record keeping | Achieved | Achieved | Achieved |
| Reporting | Achieved | Achieved | Achieved |
| Shelf life of products to approved recipients | Achieved | Achieved | Achieved |
The contracts with the three suppliers were due to expire on 30 June 2009. They all have extension provisions and during 2008–09 the NBA investigated the scope for further improving value for money. The review process demonstrated that product pricing in the current contracts provides value for money for governments, and the Jurisdictional Blood Committee considered that the existing product range should remain for the time being. The NBA has negotiated with the three suppliers to extend their contracts, achieving prices below consumer price index rises in most cases.
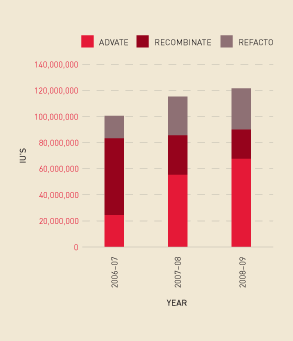
Analysis of trend information shows a continued increase in demand for Factor VIII overall— in particular, a growth in demand for recombinant, compared with plasma-derived, Factor VIII (see Figure 2.11) and an increase in the issuing per 1000 population of these products (see Figure 2.12). Some of this demand increase is explained by the fact that people with bleeding disorders are living longer, and there is an increase in product use for prophylaxis. Figure 2.13 shows the market share for specific recombinant products since 2006–07.
FIGURE 2.11 Issues of Factor VIII products, 2003–04 to 2008–09
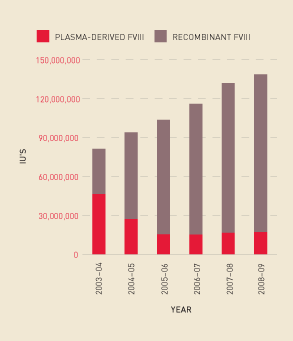
FIGURE 2.12 Issues of total Factor VIII per 1000 population, 2003–04 to 2008–09
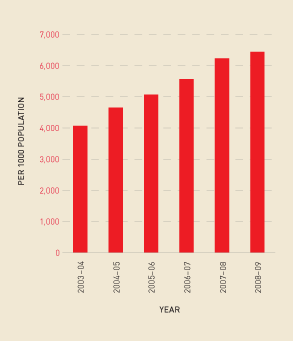
FIGURE 2.13 Recombinant Factor VIII issues: market share, 2006–07 to 2008–09
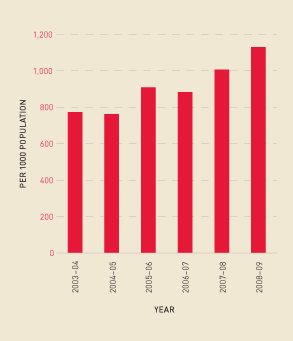
Similarly, there has been a continued increase in the total demand for Factor IX products and a move away from plasma-derived Factor IX (see Figure 2.14). Figure 2.15 shows this increase in demand reflected in total issues per 1000 population.
FIGURE 2.14 Issues of Factor IX products, 2003–04 to 2008–09
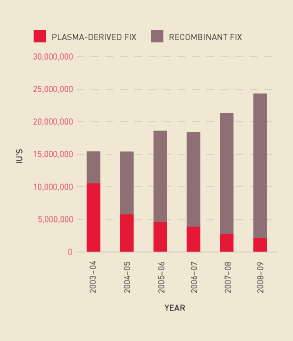
FIGURE 2.15 Issues of total Factor IX per 1000 population, 2003–04 to 2008–09
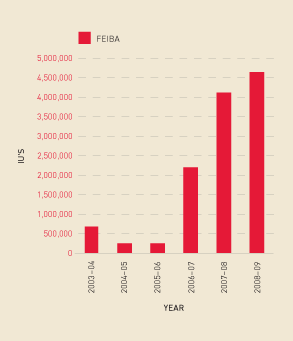
Demand for recombinant Factor VIIa, which is used for patients with inhibitors to Factor VIII, decreased in 2008–09 (see Figure 2.16). However, with the small number of patients using this product, demand is hard to predict as it can be strongly influenced by the health status of one or two patients. It is possible that some patients have transferred from Factor VIIa to Factor Eight Inhibitor Bypassing Activity (FEIBA), as FEIBA showed a significant increase in the reporting year (see Figure 2.17). The Australian Bleeding Disorders Registry should offer the NBA increased capacity to examine these trends in 2009–10.
FIGURE 2.16 Issues of recombinant Factor VIIa, 2003–04 to 2008–09
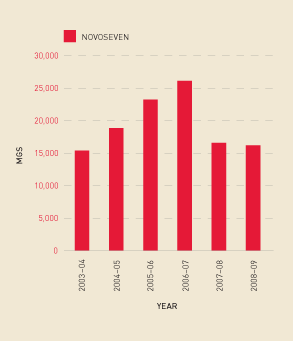
FIGURE 2.17 Issues of FEIBA, 2003–04 to 2008–09
In 2008–09 the NBA continued imports of intravenous immunoglobulin to allow us to fully meet domestic clinical demand. The cost of intravenous immunoglobulin purchased from Octapharma Australia Pty Ltd under the fixed price contract increased from $34.3 million in 2007–08 to $46.9 million in 2008–09 due to increased demand for this product and the need to build the reserves of domestic product to mitigate supply risks.
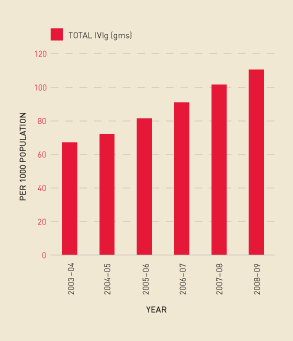
Figures 2.18 and 2.19 show that the continuing increase in demand for IVIg (measured by issues per 1000 population), has been in excess of the growth in domestic plasma collections. This has meant the percentage of imported IVIg grew from 17.9% in 2007–08 to 27.6% in 2008–09.
FIGURE 2.18 Issues of IVIg products, 2003–04 to 2008–09
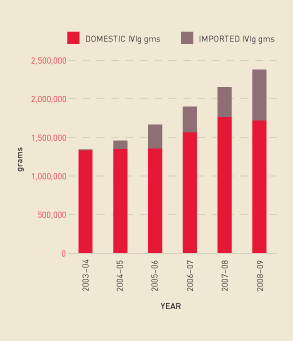
FIGURE 2.19 Issues of IVIg per 1000 population, 2003–04 to 2008–09
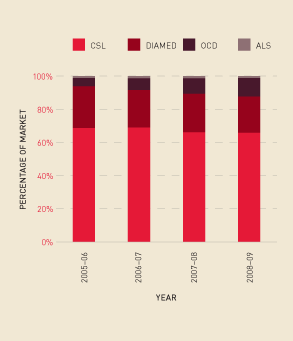
Contracts with four suppliers of diagnostic reagents—Australian Laboratory Services Pty Ltd (ALS), CSL Ltd, DiaMed Australia Pty Ltd (DIAMED) and Ortho-Clinical Diagnostics (OCD)—are due to expire on 31 October 2009. The NBA has commenced negotiations to ensure continuity of supply for these essential products beyond this date. Figure 2.20 shows that the total market share of each supplier remains relatively stable.
FIGURE 2.20 Market share for suppliers of diagnostic products, 2005–06 to 2008–09
