National Blood Authority
AUSTRALIAN HAEMOVIGILANCE REPORT
A report by the National Blood Authority Haemovigilance Advisory Committee
The data contained in this report has been collected and the report compiled by the Blood Service using data gathered from adverse events reported via the Donor Adverse Event (DAE) database. Collections staff who are responsible for the immediate management of adverse reactions which occur at the blood donor centre register such adverse events. Medical Services staff are responsible for registering events which are reported to the Blood Service after the donor has left the donor centre. Events are classified by a centralised team according to standard definitions which are largely based on definitions endorsed by the ISBT Haemovigilance Working Party. Donors are followed up by Medical Services staff according to the type and severity of reaction reported (refer to Appendix III: Definitions of donor adverse events). Donor haemovigilance data and trends are regularly monitored by the Donor and Product Safety Advisory Committee and the Blood Service Clinical Governance Committee to evaluate the impact of changes in donor selection criteria, donation processes and interventions to improve donor safety. There is also regular reporting to the Blood Service Executive and Board.
Whilst blood donation is generally a very safe process, there are recognised donor complications which can occur. Donor haemovigilance systems permit monitoring of donor safety and evaluation of the success of interventions designed to further improve donor safety. International benchmarking of donor adverse events is important but not straightforward because of different adverse event definitions, different collection processes and probably most importantly differences in reporting compliance. Estimates of adverse event incidence in blood donors based on published international studies range considerably from 5% to 33%[26],[27] and based on these rates Australia benchmarks favourably.
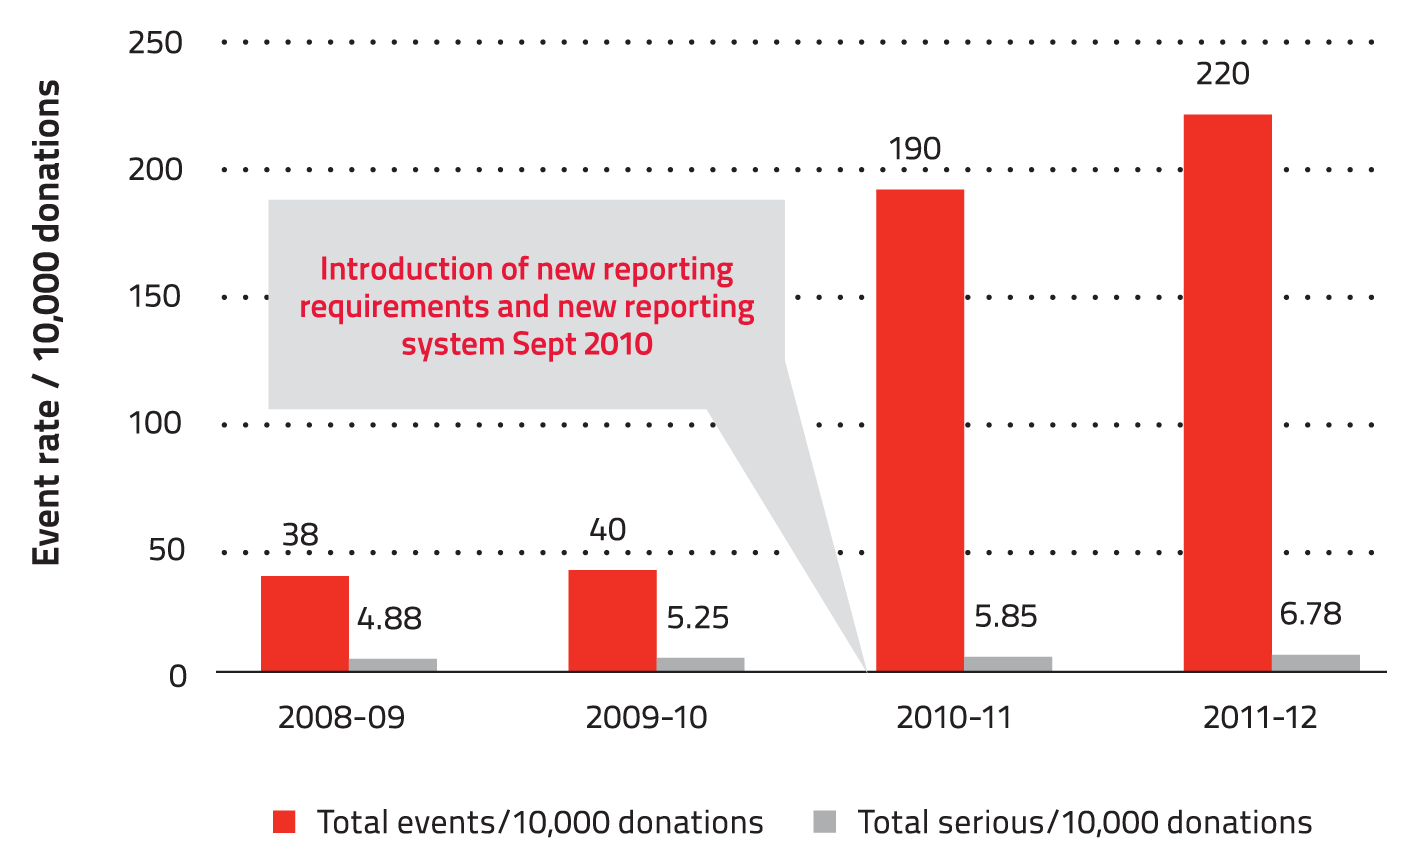
During 2011-12 there was a total of 1,342,883 donations, including 945,490 whole blood donations, 357,701 plasmapheresis donations and 39,282 plateletpheresis donations collected by the Blood Service. Total donation associated events and serious donation related events are shown in Figure 4 below.
There were 29,525 adverse events reported with the vast majority of these being classified as mild, such as the donor feeling faint for a few minutes. Adverse events can occur during and after the donation. Events which occur in the donor centre are termed immediate events. Events which occur after the donor has left the donor centre are classified as delayed events. Serious adverse events are those events where the donor requires external medical or hospital referral for the management of the adverse event and such events may be either immediate or delayed. The overall reported rate of donation related adverse events was 1:45 in 2011-12.
Figure 4: Total donation associated events and serious donation related events
The Blood Service has implemented a number of strategies to enhance reporting compliance by donors as well as donor centre and Medical Services staff. In September 2010, new standard operating procedures were introduced in which reporting requirements for adverse events changed to include the mandatory reporting of events classified as mild reactions. This change in reporting requirements occurred concurrently with the introduction of an electronic reporting system to replace a paper-based system. In January 2011 a donor wellness check was introduced whereby every time a donor presents to donate they are asked whether they experienced any problems related to their previous donation. The main purpose of the donor wellness check is to identify delayed donor reactions.
In the 12 month period following the introduction of the donor wellness check there was nearly a 50% increase in the reporting of delayed events associated with whole blood donations and a 120% increase in the reporting of delayed events associated with plasma donations. These changes were associated with an apparent increase in reaction rates, as shown in Figure 4. Table 11 shows the impact of the introduction of the donor wellness question from 31 January 2011.
Table 12 shows the rate of adverse events by donation type, and the rate per 10,000 donations.
|
Prior to
the |
After
the the wellness question |
|||
|
Total |
Serious |
Total |
Serious |
|
|
Whole Blood |
0.17% |
0.03% |
0.25% |
0.03% |
|
Plasma |
0.05% |
0.05% |
0.11% |
0.01% |
|
Platelets |
0.06% |
0.03% |
0.06% |
0.02% |
|
Procedure |
Total Donations |
Donations |
Frequency |
Rate / 10,000 Donations |
|
Whole Blood |
945,900 |
25,110 |
1:38 |
265 |
|
Plasmapheresis |
357,701 |
3,283 |
1:109 |
92 |
|
Plateletpheresis |
39,282 |
1,131 |
1:35 |
288 |
|
All apheresis procedures |
396,983 |
4,414 |
1:90 |
111 |
|
Total procedures |
1,342,883 |
29,524 |
1:45 |
220 |
Vasovagal reactions and bruising/haematoma are the most frequent complications associated with blood donation. Plasmapheresis donations are associated with the lowest frequency of adverse reactions at 1:109, and platelet donations with the highest frequency at 1:35 (Table 12). The incidence of the different types of adverse events for all donations is shown in Table 13.
Serious complications of blood donation
Serious complications related to blood donation are events resulting in any of the following:
During 2011-12 there were 331 hospital referrals and 373 general practitioner (GP) referrals for donation-related complications (Table 14). There were no donation associated deaths. The most common reason for both hospital and GP referral is slow recovery from a vasovagal reaction. Nerve irritation due to a large haematoma was the most common reason for referral for phlebotomy injury, followed by painful arm after donation (Table 15). Table 16 details donor complication rates by severity per 10,000 donations 2011-12.
|
Donor Event |
Number |
% Total Events |
Frequency |
Rate /
10,000 |
|
Immediate vasovagal |
24,225 |
82.05% |
1:55 |
180 |
|
Delayed vasovagal |
2,771 |
9.39% |
1:485 |
21 |
|
Chest pain |
48 |
0.16% |
1:27,977 |
0.4 |
|
Citrate reaction* |
233 |
0.79% |
1:5,763 |
2 |
|
Haematoma |
1,137 |
3.85% |
1:1,181 |
8 |
|
Painful arm |
431 |
1.46% |
1:3,116 |
3 |
|
Nerve irritation |
123 |
0.42% |
1:10,918 |
1 |
|
Nerve injury |
204 |
0.69% |
1:6,583 |
2 |
|
Arterial puncture |
50 |
0.17% |
1:26,858 |
0.4 |
|
Delayed bleeding |
39 |
0.13% |
1:34,433 |
0.3 |
|
Thrombophlebitis |
31 |
0.1% |
1:43,319 |
0.2 |
|
Tendon damage |
3 |
0.01% |
1:447,628 |
0.02 |
|
Allergy |
16 |
0.05% |
1:83,930 |
0.1 |
|
Other injuries** |
213 |
0.72% |
1:6,305 |
2 |
|
Total |
29,524 |
- |
1:45 |
219 |
Notes
|
Number
of |
Incidence
of hospital referrals |
Number |
Incidence
of |
|
|
Whole Blood |
284 |
0.030 |
293 |
0.031 |
|
Plasmapheresis |
37 |
0.010 |
65 |
0.018 |
|
Plateletpheresis |
10 |
0.025 |
15 |
0.038 |
|
Total |
331 |
0.031 |
373 |
0.036 |
|
|
Number
of |
Incidence
of hospital referrals |
Number |
Incidence
of (% total collections) |
|
Vasovagal Reactions |
258 |
0.019 |
112 |
0.008 |
|
Phlebotomy Injuries |
33 |
0.002 |
177 |
0.013 |
|
Chest Pain |
17 |
0.001 |
20 |
0.001 |
|
Other* |
23 |
0.002 |
64 |
0.005 |
|
Total |
331 |
0.025 |
373 |
0.028 |
Note: *Other includes injuries sustained during a faint, such as head injuries, fractures and dental injuries, and also constitutional symptoms such as extreme fatigue and palpitations on minimal exertion experienced by some donors in the days immediately following blood donation.
|
|
|
Rate per 10,000 donations |
|||
|
Whole Blood |
Plasmapheresis |
Plateletpheresis |
|||
|
(n=945,145) |
(n=350,350) |
(n=39,039) |
|||
|
Complications related to donation |
Haematoma |
Moderate |
6.82 |
8.93 |
28.43 |
|
Severe |
0.47 |
0.29 |
1.54 |
||
|
Arterial puncture |
Moderate |
0.45 |
0.09 |
0.00 |
|
|
Severe |
0.04 |
0.00 |
0.00 |
||
|
Delayed bleeding |
Mild |
0.24 |
0.40 |
0.00 |
|
|
Moderate |
0.02 |
0.00 |
0.00 |
||
|
Pain/soft tissue injury |
Nerve irritation |
Moderate |
0.79 |
0.86 |
1.28 |
|
Severe |
0.11 |
0.09 |
0.00 |
||
|
Nerve injury |
Moderate |
1.34 |
0.94 |
0.77 |
|
|
Severe |
0.34 |
0.23 |
0.26 |
||
|
Tendon damage |
Mild |
0.02 |
0.00 |
0.00 |
|
|
Moderate |
0.01 |
0.00 |
0.00 |
||
|
Painful arm |
Mild |
0.87 |
1.37 |
2.31 |
|
|
Moderate |
1.94 |
1.71 |
1.02 |
||
|
Severe |
0.36 |
0.31 |
0.00 |
||
|
Other complications with local symptoms |
Thrombophlebitis |
Moderate |
0.04 |
0.11 |
0.00 |
|
Severe |
0.16 |
0.17 |
0.00 |
||
|
Allergy (local) |
Mild |
0.18 |
0.14 |
0.00 |
|
|
Moderate |
0.01 |
0.03 |
0.26 |
||
|
Immediate vasovagal reaction |
Without injury |
Mild |
161.51 |
43.13 |
133.46 |
|
Moderate |
43.68 |
12.24 |
48.93 |
||
|
Severe |
19.72 |
5.71 |
9.99 |
||
|
With injury |
Mild |
0.00 |
0.00 |
0.00 |
|
|
Moderate |
0.11 |
0.00 |
0.26 |
||
|
Severe |
0.61 |
0.17 |
0.77 |
||
|
Delayed vasovagal reaction |
Without injury |
Moderate |
4.75 |
2.25 |
2.05 |
|
Severe |
10.18 |
3.94 |
3.07 |
||
|
With injury |
Moderate |
0.01 |
0.03 |
0.00 |
|
|
Severe |
0.90 |
0.29 |
0.00 |
||
|
Apheresis related complications |
Citrate reaction |
0.00 |
1.54 |
45.85 |
|
|
Haemolysis |
0.00 |
0.03 |
0.00 |
||
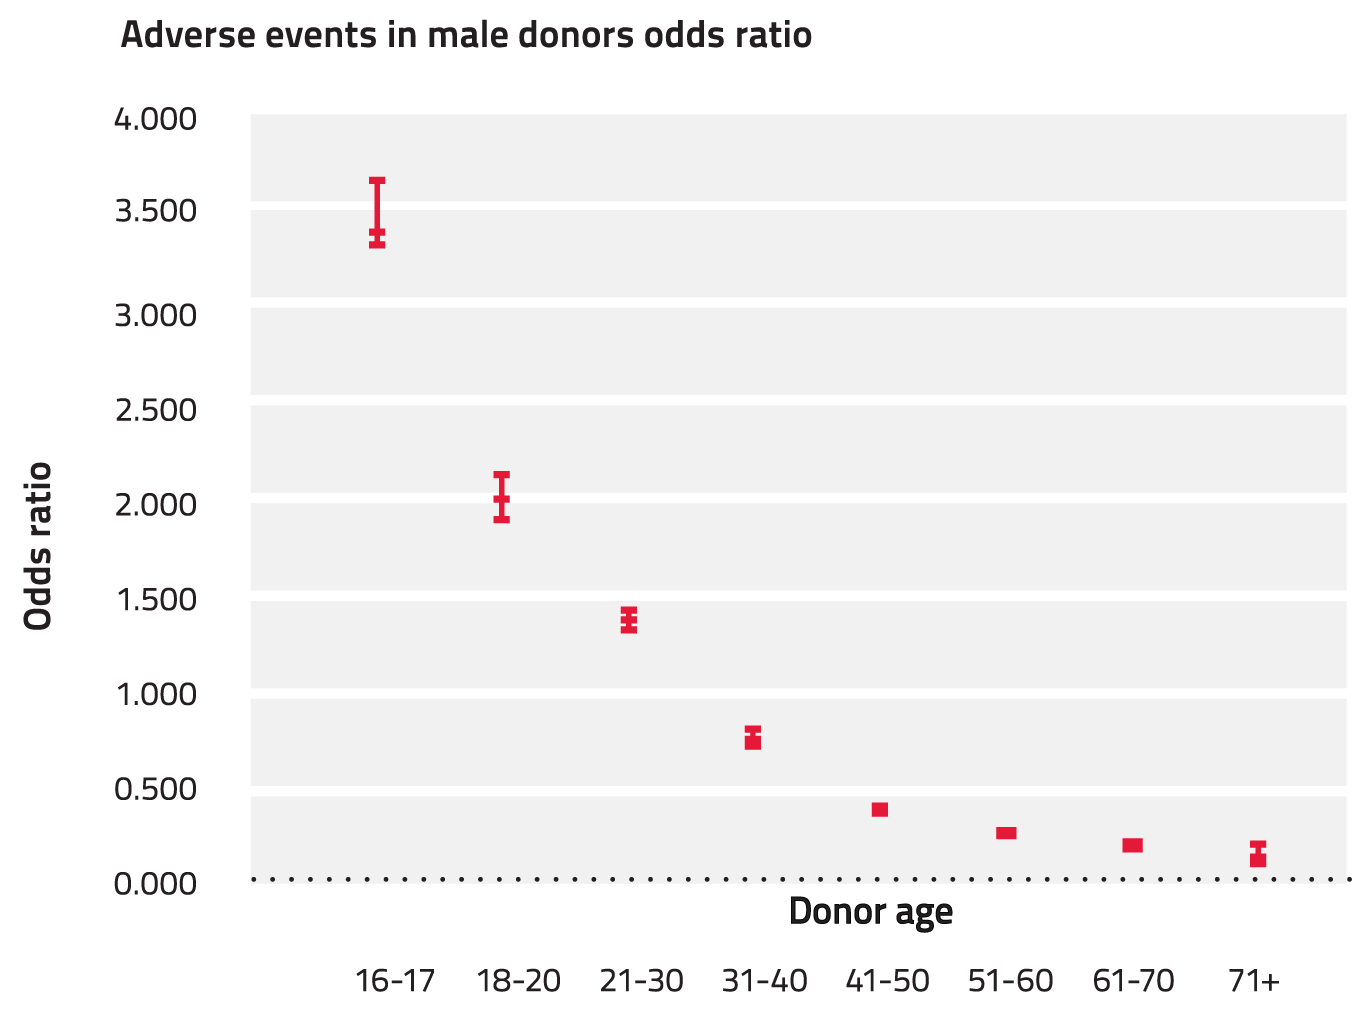
The frequency of donation-associated events is higher in younger blood donors and in female blood donors, especially those under the age of 20 years (odds ratio 3.5 for 16-17 year males, and 6.3 for 16-17 year old females). This trend is consistent with international published data.[28],[29] Safety and well-being of youth donors is a key area of focus for the Blood Service. There is a steady reduction in the likelihood of a donation reaction with increasing age (See Figure 5 and Figure 6). Refer to Appendix V for the supporting data for the calculation of the odds ratio.

Figure 5: Odds ratio for vasovagal reactions associated with all donation types 2011-12 (females)
Figure 6: Odds ratio for vasovagal reactions associated with all donation types 2011-12 (males)
Performance in relation to international blood services
There are significant challenges in benchmarking Australia's adverse events rate with event rates reported by international blood services as a result of variations in the classification of donation-associated events and also because of variations in reporting requirements between blood services and variable compliance with these requirements. Estimates of adverse event incidence in blood donors based on published international studies range from 5% - 33% and based on these rates we benchmark favourably. However there remains considerable value in benchmarking initiatives to reduce adverse events. For this reason the Blood Service regularly benchmarks with Blood Services across America, Canada, Europe and the Asia-Pacific region. Taking into consideration the significant challenges identified above, the focus is primarily on the review of strategies and initiatives being implemented to reduce adverse event rates and the impact of such interventions on local adverse event trends, rather than a comparison of absolute adverse event rates. The Blood Service is participating in work led by the ISBT Haemovigilance Working Party to improve the comparability of absolute adverse event rates.
Interventions directed at reducing the risk of adverse events: