National Blood Authority Australia
Annual Report 2010–11
Part 3: PERFORMANCE
3.2 SUPPLY OF BLOOD AND BLOOD PRODUCTS
The NBA ensures a secure supply of blood and blood products in Australia by:
- working with jurisdictions to determine and manage an annual supply plan and budget
- negotiating and managing blood supply contracts and arrangements with local and overseas suppliers
- evaluating proposals to add, remove or change blood products on the National Product Price List determined by the AHMC.
The key performance indicators for this function and our performance are described below.
| Key performance indicators | Measure | Results | |
|---|---|---|---|
| Management and coordination of Australia’s blood supply in accordance with the National Blood Agreement between the Australian Government and state and territory governments | High level of satisfaction of all funding jurisdictions with planning, management and coordination of blood supply as assessed through a survey of the JBC | 89% of jurisdictions expressed satisfaction with the NBA’s performance, with the remaining 11% being unsure. (Pages 26–55) |
|
| 2010–11 target | 2010–11 actual | ||
| Percentage of administration costs as a proportion of the national supply plan budget, under the National Blood agreement | <1.4% | 1.03% | |
| Deliverables | Measure | Results | |
| Complete contract for the importation of intravenous immunoglobulin | Contract to be effective from 1 January 2011 | After assessment of value for money and procurement requirements, and with the endorsement of jurisdictions, existing contract was extended to 30 December 2011. Tender for supply from 1 January 2012 released in May 2011. (Pages 49–50) | |
| Number of blood supply contracts managed | 14 | 14, although considerable transition planning was undertaken on new contracts commencing 1 July 2011. |
NATIONAL SUPPLY PLAN AND BUDGET (NSP&B)
The NBA’s key role is to coordinate the annual NSP&B for annual approval by health ministers. This is achieved by:
- liaising with jurisdictions and stakeholders to establish the demand for products
- collecting and distributing data on product issued and reporting this issuage to jurisdictions compared to the approved supply plan
- intensively managing products if they are in short supply.
During 2010–11, the demand levels contained in the NSP&B were met. Lists of products supplied under contract during the year are contained in Appendix 5: Fresh blood componentsand Appendix 6: Plasma and recombinant products.
The approved budget for 2010–11 covering the supply and management of blood and blood products and services under contract was $967 million, comprising $505 million for fresh blood products and plasma collection and $440 million for plasma and recombinant products. The remaining $22 million includes items such as diagnostic products, contributions for the National Managed Fund, interest monies, support for the Australian Haemophilia Centre Directors’ Organisation and administration of the ABDR.
The list of products purchased from suppliers to meet this demand is provided in Table 3.1 and Figure 3.2 identifies actual expenditure in each product category.
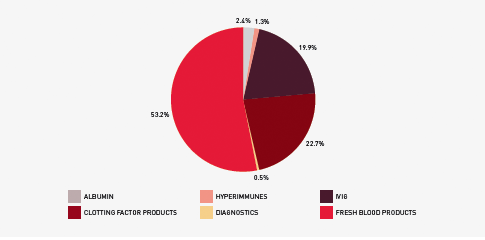
FIGURE 3.2 Funding by product category 2010–11
The total cost of products issued to all jurisdictions in 2010–11 amounted to $930.7 million (including product issued from stock). This represented an increase of $59.6 million (6.8 per cent) compared with 2009–10. Figure 3.3 indicates a reduction in issues of product against the plan for some imported products. However, the plan for this year provided for slightly higher supply levels, which had been predicted on the basis of the level of deliveries in 2008–09 and the mid-year analysis of 2009–10.
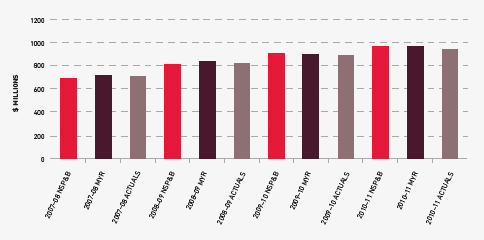
FIGURE 3.3 Actual issues performance against the NSP&B and mid-year review, 2007–08 to 2010–11
Fresh blood
In the eight years to 2010–11, funding for fresh blood and plasma collections has increased from $247.8 million to $496.57 million. Of this, $120.3 million is due to price increases averaging 7.1 per cent per year. These price increases include major realignment of the funding relationship with the Blood Service and the different cost structures incurred through the infrastructure invested in the new NSW and ACT processing site. Demand for fresh products—principally red cells, platelets and plasma for fractionation—has been increasing at 3.7 per cent a year, resulting in additional expenditure of $62.3 million. A further $66.2 million is a consequence of the introduction of government-approved quality and safety measures such as the universal leucodepletion of platelets and red cells. These safety measures have resulted in an additional increase in expenditure averaging 4.1 per cent a year. The combined effect of these measures on expenditure can be seen in Figure 3.4.
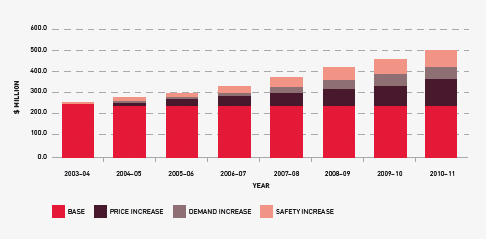
FIGURE 3.4 Fresh blood expenditure: increases on 2003–04 base year
The actual supply of fresh blood products for 2010–11 compared with the annual supply estimates agreed by the Australian Health Ministers’ Conference is highlighted in Table 3.2.
Issues of red cells
Red cells comprise 30.7 per cent of total blood and blood product expenditure and are the largest single item of cost in fresh products. The volume of red cells issued in 2010–11 was two per cent less than the volumes estimated in the NSP&B and demonstrated very minor growth (0.6 per cent) from 2009–10. All red cells were leucodepleted. The gradual decrease in the rate of growth in volume of product per 1000 head of population being observed appears to reflect the outcomes of policies driving appropriate use and improved inventory management.
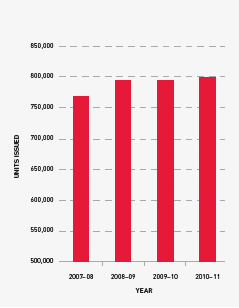
FIGURE 3.5 Red cells issued by the Blood Service, 2007–08 to 2010–11
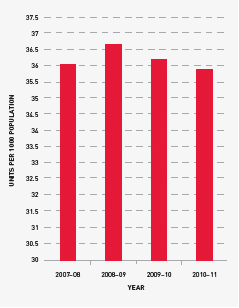
FIGURE 3.6 Red cells issued per 1000 head of population, 2007–08 to 2010–11
Issues of platelets
In 2010–11, the rate of growth slowed from 8.7 per cent in 2009–10 to 4.9 per cent. Demand for platelets is closely linked to increases in haematology/oncology activity and is also likely to be related to the wider adoption of massive transfusion protocols. The Critical Bleeding/Massive Transfusion module of the Patient Blood Management Guideline recommends a package of blood components that includes red cells, FFP and platelets as well as other products if indicated, rather than red cells alone as has been a common practice in the past. For more information on this protocol see pages 72–3.
All platelets issued in the year were leucodepleted and issues of platelets per 1000 population increased by only 3.4 per cent compared with a 7.0 per cent increase the previous year. The change in demand during 2010–11 has been in the mix of whole blood pooled and apheresis platelets. While the original plan allowed for a ratio of 55 per cent whole blood pooled to 45 per cent apheresis, after consultation with jurisdictions this was adjusted in August 2010 to 60 per cent whole blood pooled to 40 per cent apheresis.
The actual issues were 61.6 per cent whole blood pooled to 38.4 per cent apheresis.
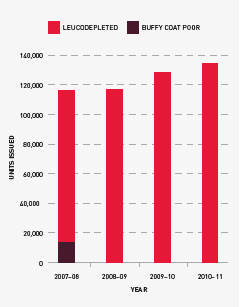
FIGURE 3.7 Platelets issued by the Blood Service, 2007–08 to 2010–11

FIGURE 3.8 Platelets issued per 1000 head of population, 2007–08 to 2010–11
Issues of other fresh products
Demand for clinical FFP was marginally less than in the 2009–10 period and was in line with the 2010–11 supply plan. The forecast growth for future years is based on population growth.
Jurisdictions had not envisaged any growth in cryoprecipitate in 2010–11; however this product saw an increase in demand of 8.3 per cent over the previous year, 9.2 per cent above plan. It remains difficult to predict demand for this blood component, as the number of patients treated with cryoprecipitate is small, but the volumes administered can be large.
Jurisdictions noted that cryoprecipitate is increasingly used in the treatment of massive bleeding and that this may drive an increase in demand in the coming years. Of note is that there is increasing interest in the use of fibrinogen concentrates as an alternate to cryoprecipitate, especially in emergency and remote settings.
Cryodepleted plasma demand increased 16.9 per cent compared with 2009–10, three per cent above plan. The reason for the increase in demand of cryodepleted plasma is not well understood and jurisdictions are not aware of significant changes in clinical practice that may be driving the increased demand. It is difficult to forecast demand for cryodepleted plasma as this product is used spasmodically and episodically in very small numbers of patients.
Details of various aspects of the NBA’s contractual arrangements with the Blood Service in 2010–11 are provided at pages 37–45.
Plasma and recombinant products
Total funding for plasma-derived and recombinant blood products increased to $433.8 million in 2010–11, an increase of $30 million (7.45 per cent) from 2009–10. As indicated in Figure 3.9 below, by far the largest proportion of this increase was due to increased product demand, notably for IVIg and clotting factors, as discussed further below. The effect of price increases was marginal, contributing only 1.6 per cent to the total increase. Prices for most products increased by less than 1 per cent, and the average unit price for domestically produced IVIg reduced by more than 2 per cent due to the favourable price structure under the CSL Australian Fractionation Agreement.

FIGURE 3.9 Plasma-derived and overseas product expenditure: cumulative increases on 2003–04 base year
Details of supply management for plasma-derived and recombinant products are provided in pages 46–53.
Issues of clotting factors
Growth in demand for recombinant Factor VIII (rFVIII) was just two per cent in 2009–10 but rose to 11 per cent in 2010–11, two per cent above the plan for this year. The 2011–12 plan was set at a lower growth rate than the 2010–11 plan based on the 2009–10 growth rate. However, in light of the actual 2010–11 figure, the apparent slowing in the rate of growth in 2009–10 may be an anomaly and further work will be undertaken to identify the factors behind the varying growth rates for this product.
Demand for clotting factors in Australia is heavily influenced by the number of patients on tolerisation and the management of prophylactic requirements. In addition, some clinicians are proactively trying to reduce use of FVIII in surgery. Respondents to the NBA’s request for information on imported plasma and recombinant products reported a declining growth rate internationally.
In Australia, settled prophylaxis protocols may lead to a lower growth rate. However, this may be offset by the rate of diagnosis of severe Haemophilia A patients in the 0–15 age group, where demand may grow as these patients increase in size.
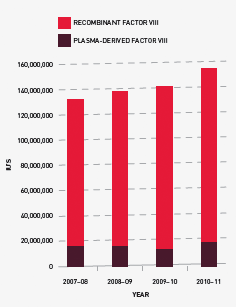
FIGURE 3.10 Issues of Factor VIII products, 2007–08 to 2010–11
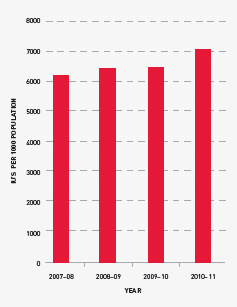
FIGURE 3.11 Issues of total Factor VIII per 1000 head of population, 2007–08 to 2010–11
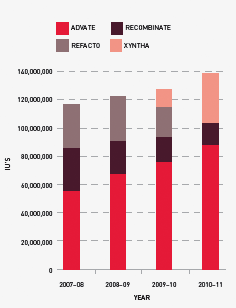
FIGURE 3.12 Market share of recombinant Factor VIII issues, 2007–08 to 2010–11
Demand for Factor IX (FIX) products in 2010–11 grew at a higher rate than previous years although, in planning consultations, jurisdictions had indicated a lower growth rate. Several local circumstances may mean that total demand for recombinant product may drop in 2011–12. Data from the ABDR would seem to indicate that the growth rate increase for FIX will be less than that of FVIII in the medium term.

FIGURE 3.13 Issues of Factor IX products, 2007–08 to 2010–11
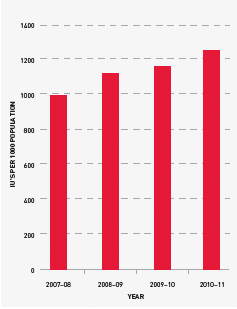
FIGURE 3.14 Issues of Factor IX products per 1000 head of population, 2007–08 to 2010–11
Jurisdictions acknowledge that a very small number of patients experiencing very high needs may considerably affect overall demand for recombinant Factor VIIa (rFVIIa) and FEIBA. The 2010–11 level of demand was 28 per cent above plan for rFVIIa and this trend is expected to continue, although at slightly lower rates of growth, for the foreseeable future. Accordingly the 2011–12 forecast is set at 17 per cent above the 2010–11 plan.
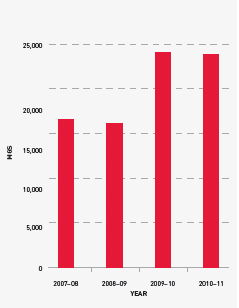
FIGURE 3.15 Issues of recombinant Factor VIIa, 2007–08 to 2010–11
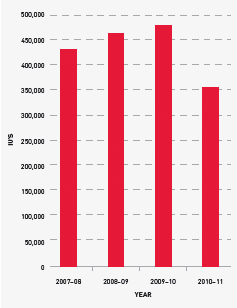
FIGURE 3.16 Issues of FEIBA, 2007–08 to 2010–11
Issues of intravenous immunoglobulin (IVIg)
Growth in demand for IVIg has slowed from 14 per cent in 2007–08 to 11.1 per cent in 2010–11. The average annual growth from 2003–04 to 2010–11 is 11.6 per cent per annum. A current international trend in increasing identification of patients with conditions that can be treated with IVIg is not noted in Australia. The only exception is an increase in demand for the treatment of acquired hypogammaglobulinaemia.
In 2010–11, a total of 2,950,371 grams of IVIg was issued, representing a cost of $149.4 million nationally (excluding cost of plasma collections). Of this, 86 per cent was IVIg produced in Australia and 14 per cent was imported. The reduction in the volume of imported product compared to last year was due to the voluntary recall of Octagam in September 2010 (see page 59). Excluding IVIg issued under direct orders, a total of 11,457 patients nationally were issued IVIg during 93,887 patient episodes.
Assessment of the proposed changes to the Criteria for the clinical use of IVIg in Australia, as detailed in the public consultation version, would indicate no new major driver for substantial growth.
The NBA produced an annual report of IVIg usage in 2010–11, in order to document the trends in the use of IVIg and provide insights into the drivers of use at the micro level. It draws on records of issues and purchases data held by the NBA, and application of IVIg to clinical indications from the Blood Service STARS database.
The report shows that there are still considerable variations in the grams issued per treatment episode across the jurisdictions for some conditions. Neurology remains the discipline using the greatest amount of IVIg and demand is still increasing. Haematology is the next largest but growth has slowed within this discipline, while growth has also declined in immunology, the third largest user of IVIg. The top three indications for which IVIg is issued most frequently are chronic inflammatory demyelinating polyneuropathy, common variable immunodeficiency disease and chronic lymphocytic leukaemia.
The report can be found on the NBA website at www.nba.gov.au.
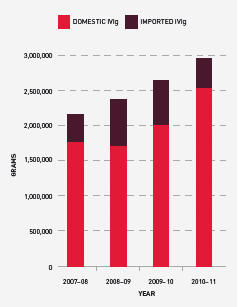
FIGURE 3.17 Issues of IVIg products, 2007–08 to 2010–11
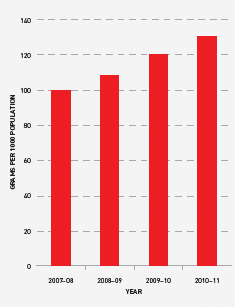
FIGURE 3.18 Issues of IVIg (grams) per 1000 head of population, 2007–08 to 2010–11
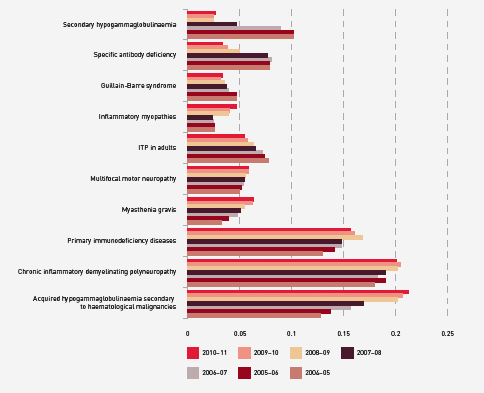
FIGURE 3.19 Top 10 uses of IVIg, 2004–05 to 2010–11
MANAGEMENT OF BLOOD SUPPLY CONTRACTS AND ARRANGEMENTS
In 2010–11 the NBA managed 14 blood and blood product supply contracts and arrangements. There were no changes in the suppliers contracted by the NBA during the year. Two contracts were extended and ten were subject to tender processes.
Contract management activities included:
- management of Australia’s fresh blood component requirements through the Deed of Agreement with the Australian Red Cross Society (ARCS)
- management of Australia’s plasma product and recombinant product requirements through:
- management of the CSL Australian Fractionation Agreement (CAFA)
- management of contracts for the provision of imported IVIg, imported recombinant factors VII, IX, and VIIa, and other imported plasma and recombinant products
- management of contracts for the provision of red cell diagnostic products.
Management of fresh blood supply arrangements
The NBA manages the relationship with the Blood Service—the sole supplier of fresh blood components in Australia—and is responsible for negotiating and managing the Deed of Agreement with the ARCS. The NBA also manages a number of projects involving the Blood Service and provides secretariat and project management support for the National Indemnity Reference Group which oversees the National Managed Fund.
Blood Service funding and product mix
Actual funding for the Blood Service increased from $456.1 million in 2009–10 to $496.6 million in 2010– 11 (see Table 3.3).
An operating surplus of $11.2 million from efficiencies achieved within the Blood Service in 2009–10 included recurrent savings of $4.7 million. The recurrent savings will be returned to jurisdictions in 2011–12 by way of lower product prices. Under the output based funding principles for 2009–10, the Blood Service was able to retain this surplus to use as agreed by governments. To date, $2.5 million of the $11.2 million has been allocated to the establishment of a Risk Reserve Pool.
Blood Service supply performance
Supply performance measures require the Blood Service to manage donations and to process the products received from these donations in an efficient and targeted manner. Governments require the Blood Service to continually improve its performance in both areas.
The Blood Service continued to perform well against all of the key performance indicators specified in the Deed. Some indicators of particular interest this year are summarised in Table 3.4. As part of the 2010–11 to 2012–13 Statement of Expectations for the Red Cross Blood Service provided by the Minister for Health and Ageing, the Hon Nicola Roxon, on behalf of all health ministers, a key performance target for the Blood Service is to improve ‘efficiency of collection (conversion of supply) for whole blood’ by 1 per cent each year during 2010–13. For 2009–10 this indicator was 78.1 per cent and for 2010–11 the target was to achieve 79.1 per cent. The Blood Service achieved 80.2 per cent.
The quantity of plasma for fractionation collected (Table 3.5) did not meet the annual supply requirements. The lower than expected volume of plasma in 2010–11 was due to:
- the reduction in the rate of growth of demand for red blood cells and apheresis platelets
- a delay in implementing the provision of apheresis platelets in additive solution instead of plasma
- the slower than planned transition of donors to higher collection volumes per donor as provided for in the current Council of Europe guidelines and the need to adjust donation volumes in response to temporarily higher than expected adverse events for donors at these larger volumes.
One strategy currently being trialled is the use of a saline replacement program and this will be evaluated by the Blood Service and the JBC late in 2011.
Deed of Agreement
Negotiations for a new deed of agreement with the ARCS commenced with the Blood Service in 2009 and the 2006–09 Deed was extended by mutual agreement of the parties until 30 June 2011. In October 2010, the ARCS wrote to the Minister to present the Society’s negotiation position in relation to the new deed, including a list of issues and desired outcomes. These issues have required detailed analysis and consideration of policy by governments and accordingly the current Deed was again extended from 1 July 2011 until December 2011 (with an option to extend until 30 June 2012).
During 2010–11, negotiations between the Blood Service and the NBA continued on operational requirements for the new deed. The JBC was involved in endorsing policy parameters to inform the priorities from government that must be achieved through the new deed. Negotiations on implementing a nine-year deed of agreement, to be supported by three-year funding and services agreements and annual service delivery plans, have progressed with the Blood Service.
Figure 3.20 below sets out the relationships between each of the elements of the proposed new deed framework.
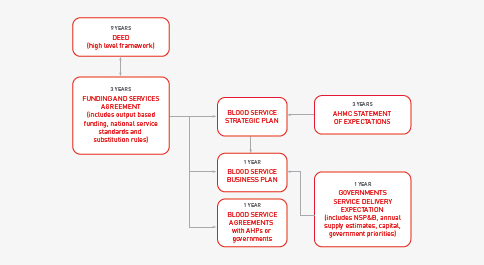
FIGURE 3.20 Framework for the new Deed of Agreement with the ARCS for the Blood Service
Funding and Services Agreement
The three-year Funding and Services Agreement and the associated operational arrangements will be informed by the three-year Statement of Expectations for the Australian Red Cross Blood Service. The current version for 2010–13 was endorsed by health ministers on 25 October 2010. The Statement sets out overarching principles and goals and contains a set of management and accountability principles addressing the core priorities of governments for improved efficiency. The Funding and Services Agreement will describe the arrangements for operational aspects of the deed framework, including:
- National service requirements and standards These will set out the Blood Service’s relationship with approved health providers (AHPs) and the NBA. They include business rules and standards for ordering, delivery, and acceptance of products which are aligned to the requirements of the new ACSQHC National Safety and Quality Health Service Standard on blood and blood product. These will guide the Blood Service in developing consistent service level agreements with AHPs
- Annual service delivery expectations will set priorities for the following year including all required products and services to meet clinical need
- Output based funding model This provides the definitions of all of the products and services to be delivered under the contractual arrangements, product prices determined by agreed cost attribution rules, cash flows, and risk management arrangements. The implementation of this model was a key focus during 2010–11 (see page 41)
- Substitution and payment rules These rules will document an agreed set of arrangements under which specific products may be supplied instead of those ordered, and the payment processes relating to receipting products that are required when this occurs
- Transfusion medicine services The Blood Service’s Transfusion Medicine Services team provides expert clinical and scientific advice, education and research, in order to improve safe and appropriate transfusion practice. Proposals for a national framework were developed and issues considered included the range of services to be provided, governance frameworks and the development of a funding structure with the key objective of ensuring an equitable allocation of services across all jurisdictions
- National research and development framework In 2010–11 the Blood Service received funding of approximately $7.5 million for its research and business development program, primarily through the Deed of Agreement. There are four research programs:
- donor and community research
- applied and developmental research
- transfusion science research
- clinical research.
The NBA and the Blood Service are working to finalise a research and development framework, which will outline the strategy to ensure appropriate incorporation of government priorities and expectations in the development and implementation of the Blood Service research program. It also describes reporting requirements that will improve the transparency to governments of activities and expenditure of the research and development program. The agreed principles and processes of the research and development framework will be reflected in the new deed.
OUTPUT BASED FUNDING—IMPROVING ACCOUNTABILITY

The new output based funding model (OBFM) for the Blood Service is helping to improve accountability, price products appropriately and deliver greater transparency of costs for jurisdictions. It enables governments to pay for the actual blood products that are delivered to approved health providers in their jurisdictions. Previously governments had made agreed budget-phased monthly payments that met the total annual costs of the Blood Service.
The OBFM was implemented from 1 July 2010 for a period of three years and will be a key component of the new Deed of Agreement with the Australian Red Cross Society for the Blood Service and the Funding and Services Agreement, that are currently being negotiated.
Two reviews of the OBFM were conducted during the first half of 2010–11 and reported to health ministers. The first review was conducted by an independent consultant who undertook a reconciliation of the cost attribution. This review was successfully completed and provided assurance to all governments that the agreed principles and cost attribution rules that underpin the methodology for determining the OBFM product prices for 2010–11 had been applied accurately and robustly.
The second was a review of the operation of the model during the initial period to identify any problems, clarify the principles of the model and provide information for the development of the 2011–12 NSP&B. This review resolved several small issues.
Each review provided opportunities for both parties to negotiate improvements during the next three-year funding cycle, under the Funding and Services Agreement.
A further review of operations will be undertaken after two and a half years to assist in the development of the next three-year funding agreement.
National inventory framework
Work commenced on developing a nationally consistent inventory framework covering blood products funded by governments and manufactured by the Blood Service. The aim is to have a comprehensive, efficient and effective inventory management strategy that will secure the supply of blood products that meet clinical demand when they are needed and also improve financial performance and reduce the amount of product that is discarded. In addition, the framework will identify stakeholder responsibilities throughout the blood supply chain and the linkages between them. Key information that will inform the inventory management framework are days of inventory at the Blood Service (see Figure 3.21), of major blood type, by month and at hospitals (data which will be available from BloodNet). Table 3.6 shows changes in red cell age at issue by quarter. Progress on the project was delayed due to reprioritisation of resources but is planned to recommence in October 2011.
FIGURE 3.21 Days of inventory at the Blood Service, of major blood type, by month, 2009–10 to 2010–11
| Q1 | Q2 | Q3 | Q4 | |
|---|---|---|---|---|
| 2009–10 | 10.5 | 10.6 | 9.8 | 7.9 |
| 2010–11 | 7.3 | 7.3 | 9.6 | 7.3 |
The Blood Service Strategic Capital Investment Plan
Under the Deed, the Blood Service is provided with an agreed capital budget, set at 10 per cent of total operational funds provided. For 2010–11, expenditure was approximately $44.07 million. Payment of the capital is through the output based funding model and is included in the product pricing. Table 3.7 shows the value of the approved annual capital plans from 2006–07 to 2010–11.
| 2006–07 $ million |
2007–08 $ million |
2008–09 $ million |
2009–10 $ million |
2010–11 $ million |
|---|---|---|---|---|
| 29.58 | 32.96 | 37.99 | 41.21 | 44.07 |
* Note that these figures represent actual expenditure. In previous years the figures reported have been the agreed budget
These funds are required to be managed through the Strategic Capital Investment Plan. The plan details the capital expenditure that is expected to be required to sustain fixed assets for three years.
In 2010–11 the Blood Service expended funds on premises (relocations and new sites), business improvement, especially their NextGen information management system, apheresis machines, replacement of computer equipment, and purchase of laboratory equipment such as analysers.
In March 2011 the JBC endorsed a Strategic Capital Investment Plan for the period 2011–14. Projected expenditure includes a detailed asset replacement program to optimise the life of equipment, and the purchase of new equipment necessary to offer improved quality and assurance processes.
The New South Wales and Australian Capital Territory principal site
In April 2008, the AHMC gave policy approval for additional funding for the Blood Service to meet building leases and fit-out for a new principal blood-manufacturing site for New South Wales and the Australian Capital Territory. Construction began in late June 2009 and practical completion was on time in January 2011 at a total cost of approximately $191 million at 2008–09 prices. The Blood Service moved into the facility over Easter 2011.
The facility was formally launched on 8 June 2011 by the Hon Catherine King MP, Parliamentary Secretary for Health and Ageing and Mr Barry O’Farrell, Premier of NSW (see page 45).
The Victoria and Tasmania principal site
In December 2008, health ministers also gave in-principle approval for additional funding for the Blood Service over 20 years to meet the costs of building and outfitting leases for a new principal blood manufacturing site in Melbourne. In the 2009–10 Federal Budget, the Treasurer announced that the Australian Government would contribute $120 million of the $212 million for this project over two years through the Health and Hospitals Fund.
The principal site is being developed in a former industrial area of inner Melbourne and construction is well underway. The NBA has continued to monitor project and funding milestones. Some delays occurred during the year as a result of extensive site remediation work and an acceleration program was developed for the fit-out phase of construction. Practical completion is still expected at the end of February 2012. When completed, the facility will be responsible for the manufacture of blood for both Victoria and Tasmania comprising 26 per cent of the nation’s blood supply.
A sample archiving facility is being built within the new site and this has been separately funded by governments to meet regulatory requirements. During the year work was undertaken on an ethics framework to govern the use of samples.
National Managed Fund
The National Managed Fund (NMF) was established to cover potential future claims made against the Blood Service in relation to the supply of blood and blood products in Australia. The Memorandum of Understanding for the management and administration of the NMF includes an expectation that the funds will earn interest to enable the real value of the annual contributions to the fund to be maintained over time and reduce the level of contributions by governments and the Blood Service. The fund was established as a discretionary managed fund with a finite scope and there is no contractual liability to agree to claims.
The National Indemnity Reference Group is a technical advisory subcommittee of the JBC on matters such as policy, review and monitoring of the Blood Service risk management strategy. The NBA provides secretariat support to the National Indemnity Reference Group, which meets twice a year.
During 2010–11, the National Indemnity Reference Group commenced a review of the scope and the discretionary nature of the NMF. At a workshop held in March 2011, the NBA, the JBC and the Blood Service discussed the non-legally binding nature of the fund, current Blood Service commercial insurance coverage, and issues associated with harmonising the statutory defence legislation across all jurisdictions.
The NBA, in collaboration with members of the National Indemnity Reference Group, developed an action plan for an extensive review of the issues raised. The plan has a specific focus on strategies to effectively manage the risks inherent in the biological nature of blood and blood products. Subject to approval by health ministers, this work will commence late in 2011.
A contract for claims management and actuarial advice was tendered in 2010–11. A three-year contract, with an option to extend for a further three years, was signed with PricewaterhouseCoopers and the new arrangements took effect on 11 February 2011. The consultant will provide all core services, including incident analysis, horizon scanning, Blood Service risk management assessment and actuarial services. In addition, PricewaterhouseCoopers will undertake claims management and update the claims manual.
STATE-OF-THE-ART BLOOD PROCESSING CENTRE OPENS

Formal opening of the Sydney Processing Centre by (from left to right) the Hon Barry O’Farrell MP, Premier of NSW, the Hon Catherine King MP, Parliamentary Secretary for Health and Ageing, and Mr David Hamill, the Chair of the Blood Service Board
The completion of Australia’s largest, state-of-the-art blood processing centre in Green Square, Sydney is part of a program of government-funded capital works being undertaken by the Blood Service to ensure that Australia’s blood sector has the key infrastructure it needs for the next 30 years.
The Sydney Processing Centre is a purpose-built, three-storey facility that is modular, flexible, expandable and scalable to meet changing requirements. The facility has been licensed by the TGA and was completed on-time and within budget.
All testing, processing, distribution, research and administration functions for the Blood Service in New South Wales will be based at this facility. A small distribution function will remain in the ACT while all other non-collection activity has been relocated to this site. The new centre will process all blood donated in NSW and the ACT (approximately 32 per cent of the total national inventory).
Other initiatives in the program include the completion of the Kelvin Grove Queensland centre in 2008 and the construction of a processing centre in Melbourne, which is due to be operational in 2012.
Speaking at the opening of the centre on 8 June 2011, the Hon Catherine King MP, Parliamentary Secretary for Health and Ageing said,
‘The Australian Government considers building health infrastructure an essential corner stone in providing the Australian people with a health care system that will meet the needs of future generations’.
The centre has been designed to ensure both security and safety for Australia’s blood supply, as well as generating manufacturing and operational efficiences to provide value for money for governments and the broader community.
From 2006–07 to 2010–11, seventeen projects costing $7 million have been funded or committed from the Blood Service Change Program Funding Pool to help the organisation transition to a national operation, deliver cost savings or otherwise increase the efficiency of the production of goods and services under the current Deed of Agreement. No new commitment of funds was made during 2010–11. However, work continued on eight projects as detailed in Table 3.8. The projects are expected to be completed in 2013–14.
Management of plasma and recombinant product supply arrangements
The NBA is responsible for negotiating and managing contracts and standing offers with commercial suppliers of blood and blood products. These contracts relate to the supply of locally produced plasma-derived products; imported plasma-derived and recombinant products and diagnostic reagents.
Locally produced plasma-derived products: CSL Australian Fractionation Agreement
In Australia, CSL fractionates plasma from donations collected by the Blood Service. Plasma fractionation arrangements are currently governed by the CSL Australian Fractionation Agreement (CAFA) which took effect on 1 January 2010. The CAFA sets out CSL’s obligations regarding plasma stewardship, production, inventory management, product quality, pricing and payments, supply, reporting and performance and risk management.
Actual funding for CSL increased by $28.1 million in 2010–11, from $182.4 million in 2009–10 to $210.5 million in 2010–11 (see Table 3.9). This represents an increase of 15.4 per cent (the same proportional increase as in 2009–10) compared to an average annual increase of 6.1 per cent from 2003–04 to 2009–10. The increase from 2009–10 to 2010–11 comprises a volume-based increase valued at $31.5 million and a price-based saving of $3 million. The price-based saving arises from the pricing structure of the CAFA, by which the average price for IVIg reduces as IVIg supply volumes increase.
Three products contributed to most of the volume-based increase in 2010–11:
- a 19 per cent increase in IVIg issued by CSL in response to the Octagam recall, as a result of increased plasma levels, and due to better plasma stock management. This contributed to a higher level of Australian self-sufficiency for IVIg
- a 55 per cent increase in demand for plasma-derived FVIII
- a 31 per cent increase in demand for prothrombin complex concentrate.
A number of elements of the CAFA have been subject to an agreed transition process. A Joint Transition Group was established between CSL and the NBA to implement the transition actions. New reporting arrangements have been developed and plans to maintain minimum product and national reserve inventory levels were initiated during the year.
The suite of performance indicators in the CAFA is intended to highlight those areas of CSL’s performance that are of most significance to product recipients and funding governments. They cover:
- plasma stewardship—the amount of starting plasma funded by the NBA which is lost through the processes of manufacturing and distribution
- production yield—the annual average yield of IVIg production, with contractual incentives to achieve in excess of an annual average yield of 5.2 grams of IVIg per kilogram of starting plasma
- management of required inventory levels—maintenance of the required minimum inventory levels of starting plasma and finished products held either in CSL inventory or the NBA-funded National CSL Reserve
- fulfilment of orders—fulfilment of orders on time, in full, to the right recipient and otherwise in accordance with the requirements of the agreement
- shelf life of National CSL Reserve products—maintenance of required minimum shelf life for products held in the NBA-funded National CSL Reserve.
The process of measuring performance against the indicators provides incentive for high levels of performance by CSL through the application of a balanced regime of payment consequences, including a payment incentive for IVIg yield and structured rebates on other key performance indicators for performance below agreed tolerance thresholds.
In 2010–11, CSL performed well against the CAFA key performance indicators as shown in Table 3.10.
# CSL has recently raised with the NBA the need to consider the effects of changes in plasma collection practices on CAFA contractual provisions relating to IVIg yield.
* The first full year of implementation of the CAFA has indicated a need for the NBA and CSL to review minimum inventory levels in the CSL Inventory and National CSL Reserve in order to optimise production planning against supply, shelf life and product expiry risk.
The CAFA establishes an ongoing dialogue between CSL and the NBA through an annual cycle of management and executive meetings to discuss and monitor strategic and operational matters. In 2010–11, CSL and the NBA held four contract management meetings and an annual Risk Management Workshop in August 2010. In addition, two update and planning meetings were held between the Chief Executive Officers of the NBA and CSL. Topics discussed between the CEOs included:
- CSL’s global insurance and risk management, including its Australian operations
- CSL’s business planning for services to support the supply of products under the CAFA
- trends and forecasts for products in Australia and globally
- CSL’s research and development program
- CSL’s investment in, and upgrading of, its Broadmeadows facility.
During the year, two new CSL products provided under the CAFA were approved by the JBC for supply through the NSP&B commencing in 2011–12:
- Rh(D) Immunoglobulin made with a new glycine formulation—the previous version of the product used normal immunoglobulin and the move to the new formulation will therefore allow more of the plasma available to be used for IVIg production
- Biostate in a 1000 IU presentation size, which will be welcomed by the clinical and patient communities for its dosage administration benefits.
The NBA further refined audit procedures associated with goods ordering and receipt verification, to ensure that these remain appropriate under the CAFA. NBA officers, accompanied by external auditors appointed by the Australian National Audit Office, conducted the end of financial year stock take of the National CSL Reserve in Melbourne, Sydney and Brisbane.
Imported intravenous immunoglobulin
Imported intravenous immunoglobulin supplements domestic IVIg production to meet clinical demand in Australia. In addition to supply under the national blood arrangements, the NBA also supports the purchasing of small amounts of IVIg using jurisdictional Direct Orders.
The contracts in place for supply of imported IVIg during 2010–11 were:
- with Octapharma Australia (Octapharma) for the supply of Octagam, which had been extended in May 2010 to operate until 31 December 2011
- the Direct Order contract established with Lateral Diagnostics in 2009–10.
In September 2010, Octapharma issued a nationwide voluntary recall of Octagam due to production concerns; see page 59 for more information on the recall and pages 100–1 for further details of impact of the Octagam issue worldwide.
To enable domestic demand to be met, the NBA invoked relevant clauses which had been included in the contract with Lateral Diagnostics to allow supply of Flebogamma through the national blood arrangements (in addition to the Direct Orders supply). Lateral Diagnostics, working with the Spanish-based manufacturer of Flebogamma, Grifols S.A., responded rapidly and fully to the NBA’s additional requirements and this arrangement continued for the remainder of the year. The voluntary recall of Octagam was still in place in Australia at 30 June 2011.
In 2010–11, the NBA spent $33.45 million under these contracts, comprising $8.95 million for Octagam (net of credits in relation to the voluntary product recall) and $24.5 million for Flebogamma.
Octapharma’s performance against the key indicators in its contract, up to the time of the recall, is set out in Table 3.11.
As it was primarily established for the purpose of Direct Order requirements, the NBA’s contract with Lateral Diagnostics does not include a specific set of key performance indicators relating to supply under the national blood arrangements. However, the company met all requirements for supply.
On 6 May 2011, the NBA released a request for tender for the procurement of imported IVIg products under the national blood arrangements. The new supply arrangements are to begin on 1 January 2012; see page 52 for more information on procurement.
Prior to the release of the tender, the NBA informed all potential suppliers of its intention and followed its normal practice of consulting clinical stakeholders in order to update background information on the current arrangements for imported IVIg and on historical and forecast demand for IVIg.
The policy position taken for the imported IVIg tender involves the introduction of a second supplier for imported IVIg under the national blood arrangements. This is intended to introduce improved supply security into the supply of imported IVIg, to provide clinicians with choice of product and to maintain competitive pressure on price and performance standards.
Imported plasma-derived and recombinant blood products
The NBA has established contracts with overseas suppliers for the importation of selected plasma-derived and recombinant blood products to augment domestic supply in cases where these products are not produced in Australia or domestic production cannot meet demand.
Since 2006, the NBA has maintained contracts with three overseas companies: Baxter Healthcare, Novo Nordisk Pharmaceuticals and Wyeth Australia (now Pfizer Australia Pty Ltd). Contracts with Baxter Healthcare and Wyeth Australia had been extended until June 2011 and the contract with Novo Nordisk Pharmaceuticals was extended until June 2012.
In 2010–11, the NBA spent $181.33 million under these contracts for the supply of imported blood products, as is shown in Table 3.12.
Consistent with previous years, 2010–11 performance against contractual key performance indicators was high (see Table 3.13).
* In these instances, the performance of the relevant supplier departed from the contracted requirement at some periods during the year, but without a material effect on supply performance or supply security. Such instances are managed through specific prior approvals from the NBA, and increased discussion and scrutiny of supplier performance at regular contract management meetings
During 2010–11, the NBA conducted a procurement process to establish new supply contracts for imported plasma and recombinant products from 1 July 2011.
The process began in July 2010 with the NBA seeking advice from key stakeholder groups and suppliers to inform development of the tender. The NBA also reviewed its contract management arrangements and investigated other relevant supply and market information.
After the information gathering phase was complete, the JBC endorsed a set of policy parameters for the tender process based on advice from the NBA. These included:
- ensuring that the procurement outcomes:
- represent sound, demonstrable value for money for Australian governments
- provide an adequate, secure and affordable supply of imported plasma and recombinant products
- take into account clinician and patient views
- a preference for two national suppliers of recombinant Factor VIII, provided other procurement goals are able to be met
- negotiating prices that are no less favourable, in real terms, than the current prices
- ensuring a product mix that includes the latest generation of products available in Australia at the time of the tender, providing the mix meets other policy parameters.
The request for tender for imported plasma and recombinant products was released in November 2010. The tenders were reviewed by an evaluation committee that included stakeholders with relevant expertise and the outcome was announced in early June 2011.
A particular policy issue for the procurement of imported plasma and recombinant products was the number of suppliers and products to include in the supply arrangements for rFVIII. The policy decision to retain the previous model of two rFVIII suppliers was seen as balancing the objective of providing some choice of products for clinicians and patients, while at the same time retaining competitive pressure on price and supplier performance. The decision recognises that Australia has a relatively small level of demand; and that this makes it more difficult to achieve good procurement outcomes in a market that has a small number of suppliers world-wide.
SECURING SUPPLY—IMPROVING VALUE FOR MONEY

As a result of our recent tender processes Australian governments will save between $10 million to $30 million per year for the next three years, without compromising clinical efficacy or patient safety. With six existing contracts being extended and the release of three tenders for contracts due to expire, 2010–11 was a busy year.
Important improvements have been negotiated for the new supply arrangements for the main clotting factor products, including:
- introducing a new supply security concept that requires suppliers to hold stock within their global supply chain which is dedicated to Australia, in addition to an in-country inventory reserve
- strengthening the consequences associated with suppliers not meeting key performance indicators related to in-country reserve and the shelf life of product on delivery
- encouraging suppliers to pursue initiatives to improve the environmental sustainability of supply arrangements by reducing waste through the return, reuse and/or recycling of cold chain packaging or through the use of cold chain transportation
- introducing specific obligations on the part of suppliers to provide customer feedback mechanisms and demonstrate responsiveness to feedback.
These outcomes are a result of extensive preparations and tender processes. We start preparing at least a year before releasing tenders. We:
- gather information on the global market
- obtain information and customer feedback from suppliers and stakeholders on the level of satisfaction with the current supply arrangements, the products needed and the availability of product choice, the tender period preferred by suppliers and the potential for product enhancements during that time, the extent of competition for supply of specific products, and price considerations
- review the current arrangements to identify where improvements might be gained (e.g. security of supply, safety and value for money)
- use our knowledge of normal supply chain and commercial arrangements of suppliers to design arrangements that suppliers can achieve and sustain.
The new arrangements give patients in Australia secure access to products equivalent to those available in other parts of the world at competitive prices. The new arrangements will remain in place for a minimum of three years, from 2011–12 to 2013–14.
The new contracts will see the introduction of Kogenate and the phasing out of Advate and Recombinate, as shown in Table 3.14.
# Provided under ad hoc arrangements to meet clinical requirements.
In applying the two-supplier model the outcomes of the tender process will require a significant number of patients to change products. This transition process is being closely managed by the NBA in cooperation with clinical and patient stakeholder groups, jurisdictions and suppliers. It is expected that most patients needing to change products will have done so within the first six months of the new supply arrangements.
The new supply arrangements for imported plasma and recombinant products will formalise the contractual frameworks for the supply of certain products by home delivery to appropriate patients, under the supervision of a haemophilia treatment centre.
The NBA is working closely with members of the Haemophilia Foundation of Australia, the Australian Haemophilia Centre Directors’ Organisation (AHCDO), the Australian Haemophilia Nurses Group, the Blood Service and the contracted suppliers, to manage the transition of patients between rFVIII products. Additional funding will be provided to haemophilia treatment centres, through AHCDO, to meet the extra costs associated with the transition and to monitor any changes to adverse events arising from the change in products.
Diagnostic reagent products
Diagnostic reagents are used in laboratory tests known as blood typing and cross matching. These tests ensure that a person needing a blood transfusion receives blood compatible with their own. Australian governments currently subsidise the purchase of around 110 in-vitro red cell diagnostic reagents by public laboratories and the Blood Service, through the National Blood Agreement.
During 2010–11 the NBA had contracts with four suppliers for the supply of diagnostic reagents to public laboratories: CSL Limited, Lateral Diagnostics, ALS–Abacus and OCD (Johnson & Johnson trading as Ortho-Clinical Diagnostics).
The four contracts were due to expire on 31 October 2009 but, following consideration in 2008–09, were extended for one year. Following further stakeholder consultation, the contracts were extended again to June 2011, to align with the financial year. The NBA successfully negotiated prices for the final period that were lower than the CPI increases for that period.
Funding for diagnostic reagent supply is capped at $4.8 million per year. The NBA manages the cap for all jurisdictions across 70 facilities and our four suppliers.
Figure 3.22 shows that the total market share of each supplier has remained relatively stable during the year.
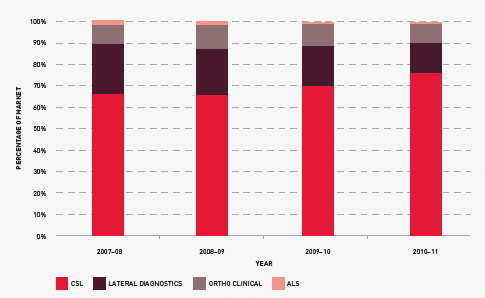
FIGURE 3.22 Market share for suppliers of diagnostic reagent products, 2007–08 to 2010–11
The NBA used the same approach to procurement of diagnostic reagents as that used for imported plasma and recombinant products. JBC representatives, a number of public laboratories and current and potential suppliers were all consulted. Feedback was obtained on recent or potential changes to demand for red cell diagnostic reagents, product range, issues with the current standing offer arrangements, the strength of the supplier market and issues around improving the management and allocation of the products.
These consultations highlighted that the TGA regulatory reforms for diagnostic reagents will be a key challenge in the future. In September 2010, the JBC endorsed policy parameters for the tender, as follows:
- establishment of a standing panel to help ensure a commercially competitive supply to public laboratories and the Blood Service of a range of red cell diagnostic reagents that represents value for money
- three-year contracts with options for the NBA to negotiate two additional one year extensions
- arrangements to include an efficient periodic review process to allow for the addition or removal of products or suppliers as a result of regulatory or market changes.
The NBA released the tender in December 2010 and the new arrangements took effect on 1 July 2011. Bio-RAD Laboratories has been added to the four existing suppliers. The new contracts for all suppliers will continue to provide public pathology laboratories with a wide choice of products and the ability to procure the most appropriate diagnostic blood products at competitive prices, quality and service levels.
EVALUATION METHODOLOGIES FOR CHANGE PROPOSALS
Under the National Blood Agreement, interested parties can make proposals for changes to products or services on the National Product and Price List. Schedule 4 of the Agreement provides for evidence-based evaluation, information and advice to support decisions on these changes in the context of the primary and secondary objectives of the Agreement (see Appendix A).
The JBC is responsible for considering national blood supply change proposals; obtaining appropriate evaluation, information and advice; and making decisions on proposals in certain circumstances, or providing advice and recommendations on proposals to the AHMC.
The NBA has developed a comprehensive framework for assessing products that addresses relevant policy considerations and the cost-effectiveness of the proposals on the blood sector and, where relevant, the wider health sector. This multi-criteria analysis framework quantifies consideration of each of the objectives of the National Blood Agreement and provides consistent rigour for the assessment process.
In 2010–11, DoHA was provided with funding for the development and implementation of an assessment process for blood and blood products, particularly matters of cost-effectiveness and clinical need, to help decide whether a product should be publicly funded.
In March 2011, the JBC was advised that the Minister had determined that the Medical Services Advisory Committee (MSAC) had been approved to undertake the detailed cost-effectiveness analysis on behalf of the Commonwealth. Findings from the MSAC assessment are expected to be shared with states and territories to inform the overall assessment under the NBA’s multi-criteria analysis framework.
Two within-category[1] and non-complex proposals were assessed and will be available through the NSP&B from 1 July 2011.
A number of other applications were received and will be assessed during 2011–12.
[1] Within category proposals are defined as changes to products already approved by health ministers and which are already listed on the National Product and Services List
