
Objective 1. Secure the supply of blood and blood products
It is the responsibility of the National Blood Authority (NBA) to manage the national blood supply to ensure that healthcare providers have sustainable, reliable and efficient access to blood and blood products needed for patient care. NBA ensures blood supply security by working with states and territories to determine and manage an annual supply plan and budget and negotiating and managing blood supply contracts and arrangements with local and overseas suppliers.
National Supply Plan and Budget
A key element of the NBA’s role in ensuring security of supply is to develop, coordinate and monitor the annual National Supply Plan and Budget (NSP&B), including obtaining annual approval from health ministers.
This is achieved by:
- developing a national estimate of product demand
- liaising with states and territories to refine the estimated demand for products
- collecting and distributing data on product issued and reporting variations to jurisdictions on the approved supply plan
- intensively managing products if they are in short supply.
Performance against the 2013–14 NSP&B
Throughout 2013–14, products were supplied to meet clinical demand and supply risks were effectively managed. The approved budget for 2013–14 covering the supply and management of blood and blood products and services under contract was $1,158.09 million, comprising $612.75 million for fresh blood products and plasma collection (see Fresh blood products) and $526.16 million for plasma and recombinant products (see Plasma and recombinant products). The remaining $19.18 million included items such as support for the publication of Patient Blood Management (PBM) Guidelines, maintenance of the Australian Haemophilia Centre Directors’ Organisation (AHCDO) and administration of the Australian Bleeding Disorders Registry (ABDR).
Table 2.1 identifies the NBA’s expenditure in 2013-14 and earlier years by supplier for the supply of products in each product category.
TABLE 2.1 Blood and blood products purchased, by supplier, 2009-10 to 2013-14
| Supplier | Products Purchased | 2009-10 ($M) | 2010-11 ($M) | 2011-12 ($M) | 2012-13 ($M) | 2013-14 ($M) |
|---|---|---|---|---|---|---|
| CSL Behring (Australia) Pty Ltd | Plasma Products
|
186.16 | 215.15 | 228.22 | 222.02 | 210.10 |
| Australian Red Cross Blood Service | Fresh Blood Products
|
456.12 | 496.57 | 526.35 | 549.31 | 583.13 |
| Baxter Healthcare Pty Ltd | Imported Plasma and Recombinant Products
|
90.62 | 96.93 | 45.95 | 6.301 | 8.25 |
Imported IVIg |
Nil | Nil | 7.37 | 26.76 | 29.20 | |
| Bayer Australia Limited | Imported Plasma and Recombinant Products
|
Nil | Nil | 11.30 | 34.96 | 35.14 |
| Pfizer Australia Pty Ltd | Imported Plasma and Recombinant Products
|
48.94 | 57.03 | 66.55 | 93.28 | 93.05 |
| Novo Nordisk Pharmaceuticals Pty Ltd | Imported Plasma and Recombinant Products
|
26.42 | 27.37 | 24.55 | 33.60 | 27.20 |
| Octapharma Pty Ltd | Imported IVIg | 48.69 | 8.95 | 23.38 | 49.10 | 46.00 |
| Grifols Australia | Imported IVIg | Nil | 24.50 | 22.51 | 0.28 | Nil |
Diagnostic Reagent Products
|
0.81 | 0.60 | Nil | Nil | 0.32 | |
| Ortho-Clinical Diagnostics (Johnson & Johnson Medical Pty Ltd) | Diagnostic Reagent Products
|
0.43 | 0.38 | 0.45 | 0.44 | 0.43 |
| Bio-Rad Laboratories Pty Ltd | Diagnostic Reagent Products
|
Nil | Nil | 0.13 | 0.63 | 0.57 |
| Abacus ALS Pty Ltd | Diagnostic Reagent Products
|
0.04 | 0.03 | 0.05 | 0.04 | 0.04 |
| Total Purchases of Blood and Blood Products | 858.23 | 927.51 | 956.81 | 1016.72 | 1033.43 | |
1 In last year’s annual report, the 2012-13 Baxter Healthcare Pty Ltd Imported Plasma and Recombinant Products figure of 33.06 included 6.30 Imported IVIg which has a separate category in this report. Care should be taken in making comparisons with previous reports.
Fresh blood products
The list of fresh blood products supplied in 2013-14 is at Appendix 2 Fresh blood components supplied under contract by the Blood Service. The four main products were:
- red blood cells
- platelets
- clinical fresh frozen plasma
- plasma for fractionation
As demonstrated in Table 2.2, fresh blood expenditure has significantly increased over the last ten years at an average of nine per cent per annum. A range of factors have contributed to this significant and sustained increase.
TABLE 2.2 Fresh blood expenditure: increases on 2004-05
| Year | Amount ($M) | Growth ($M) |
|---|---|---|
| 2004-05 | 277.0 | 11.8 |
| 2005-06 | 297.7 | 7.5 |
| 2006-07 | 327.1 | 9.9 |
| 2007-08 | 369.1 | 12.8 |
| 2008-09 | 417.2 | 13.0 |
| 2009-10 | 456.1 | 9.3 |
| 2010-11 | 496.6 | 8.9 |
| 2011-12 | 526.3 | 6.0 |
| 2012-13 | 549.3 | 4.4 |
| 2013-14 | 583.1 | 6.2 |
| Total | 4,299.5 | 9.0 (average) |
In the 11 years to 2013–14, expenditure on fresh blood and plasma collections has increased from $247.8 million to $583.1 million. Key drivers of this increase are as follows:
- $229.7 million is due to price increases averaging 9.4 per cent per year. This includes major additional operational costs and investment in principal sites such as the Sydney and Melbourne processing centres.
- $65.4 million is due to demand changes— principally red cells, platelets and plasma for fractionation. Importantly, there has been a reduction in demand for red cells and platelets over the last three years as a result of improved appropriate use and reduced wastage.
- $44.7 million is due to the introduction of government-approved quality and safety measures such as the universal leucodepletion of platelets and red cells. These safety measures have resulted in an additional increase in expenditure averaging 1.8 per cent a year.
The combined effect of each of these cost increase drivers on expenditure can be seen in Figure 2.1.
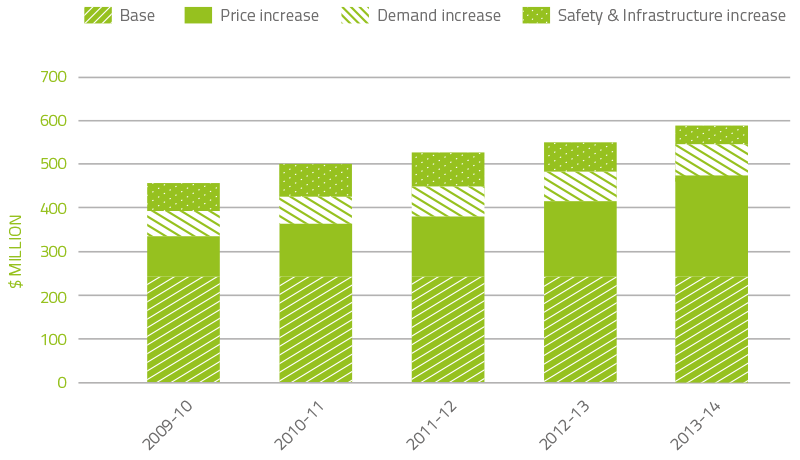
FIGURE 2.1 Fresh blood product expenditure: cumulative increases on 2003–04 base year
Red blood cells
Red blood cells comprise approximately 25 per cent of total blood and blood product expenditure and are the largest single item of cost in fresh products. Figure 2.2 illustrates that there was a decline in issues of red blood cells (7.9 per cent) compared to 2012-13, with continuation of the steady decline in issues per 1,000 head of population. The decline in red cell demand is the result of the ongoing success of programmes to improve appropriate use and reduce wastage. The NBA and other blood sector stakeholders have been focused on practice improvement, including improving appropriate use through the publication and implementation of PBM Guidelines (see Reference Development) and decreased wastage through improved inventory management (see Best practice tools section).
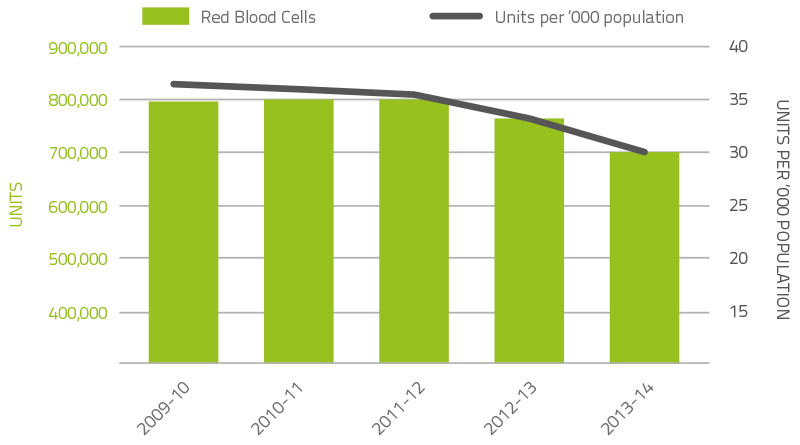
FIGURE 2.2 Red cells issued by the Blood Service, issued and per ‘000 of population, 2009-10 to 2013-14
Platelets
Platelets comprise five per cent of total blood and blood product expenditure. Figure 2.3 illustrates that there was a decline in issues of platelets (three per cent) from 2012-13 and a continued decline in issues per 1,000 head of population. As with red cells, the decline is the result of the ongoing success of programmes to improve appropriate use and reduce wastage. Platelets are either derived from an apheresis collection or a whole blood collection. In 2013-14, platelets issued were 61.3 per cent whole blood pooled (62.4 per cent in 2012-13) and 38.7 per cent apheresis (37.6 per cent in 2012-13).
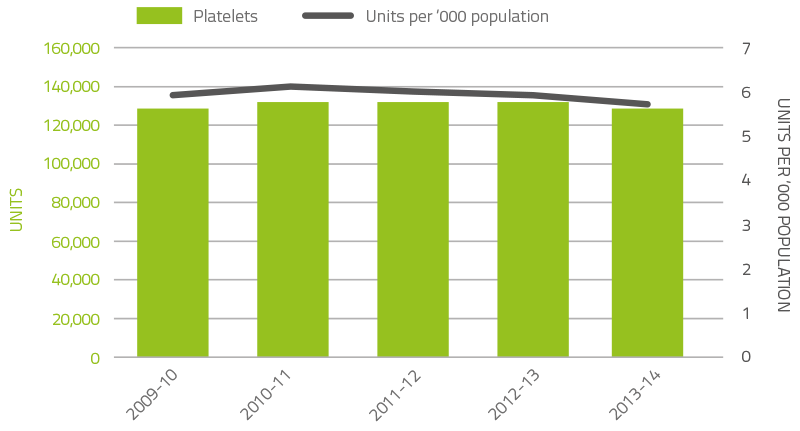
FIGURE 2.3 Platelets issued by the Blood Service, issued and per ‘000 of population, 2009-10 to 2013-14
Plasma for fractionation
The Blood Service collects plasma for fractionation to supply to CSL Behring (Australia) Pty Ltd for the manufacture of plasma derived products. In 2013-14, the target for the quantity of plasma to be collected by the Blood Service was 545 tonnes, which the Blood Service successfully achieved. The growth in plasma collection by the Blood Service over the last decade is shown in Table 2.3.
TABLE 2.3 Blood Service: plasma volumes collected for fractionation (tonnes), 2004–05 to 2013–14
| 2004-05 | 2005-06 | 2006-07 | 2007-08 | 2008-09 | 2009-10 | 2010-11 | 2011-2012 | 2012-13 | 2013-14 |
|---|---|---|---|---|---|---|---|---|---|
| 308.1 | 308.4 | 329.3 | 352.8 | 390.7 | 452.4 | 472.3 | 502.2 | 525.2 | 545.1 |
Plasma and recombinant products
The cost of plasma derived and recombinant blood products issued under NBA arrangements in 2013–14 increased to $488.13 million, an increase of $24.15 million (5.2 per cent) from 2012–13. The largest proportion of this increase was due to increased product demand for intravenous immunoglobulin (IVIg). Prices for most products increased by less than two per cent, and the average unit price for domestically produced IVIg decreased by 0.6 per cent due to the favourable price structure under the CSL Australian Fractionation Agreement (CAFA).
In the 11 years to 2013-14, expenditure on plasma and recombinant products issued under NBA arrangements has increased from $205.2 million to $488.13 million. Key drivers of this increase are as follows:
- $243.9 million is due to increased demand
- $51.8 million is due to the safety based government policy decision to introduce full funding to allow access to recombinant clotting factor products (rFVIII and rFIX).
The combined effect of each of these cost increase drivers on expenditure can be seen in Figure 2.4. It is of note that the contribution of price has either been a small increase, or a small to moderate saving. On average, price changes have contributed to a reduction in expenditure of 5.7 per cent per year for the last ten years.

FIGURE 2.4 Plasma derived and overseas product expenditure: cumulative increases on 2003–04 base year
Issues of clotting factors
Clotting factors comprise 18.4 per cent of total blood and blood product expenditure. Figure 2.5 indicates that the demand for factor VIII products decreased by 0.8 per cent when compared to 2012–13. The demand for recombinant FVIII decreased by 1.3 per cent compared to the demand for 2012-13. Conversely plasma derived FVIII demand increased 3.5 per cent due to additional requirements for immune tolerisation therapy.
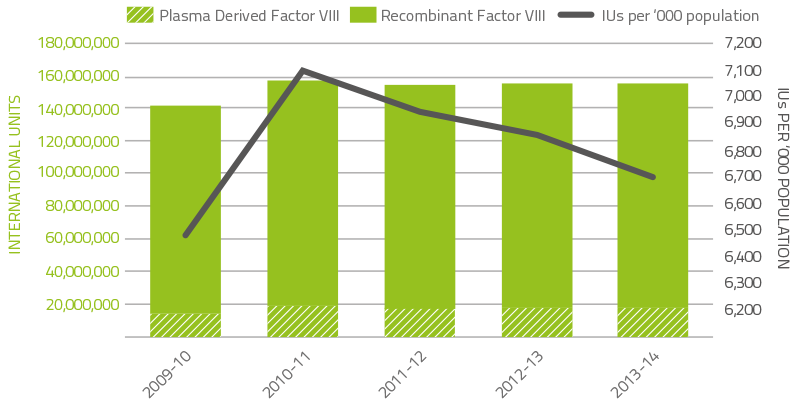
FIGURE 2.5 Issues of Factor VIII products, 2009–10 to 2013–14
Figure 2.6 indicates that demand for factor IX (FIX) products in 2013–14 increased by 8.6 per cent compared to 2012-13. Plasma derived FIX increased by 48.5 per cent due to specific patient requirements. Recombinant FIX increased 4.6 per cent largely as a result of newly diagnosed patients.
Patients commencing or ceasing participation in company clinical trials also contributed to the variability of year-to-year growth rates for both FVIII and FIX products.
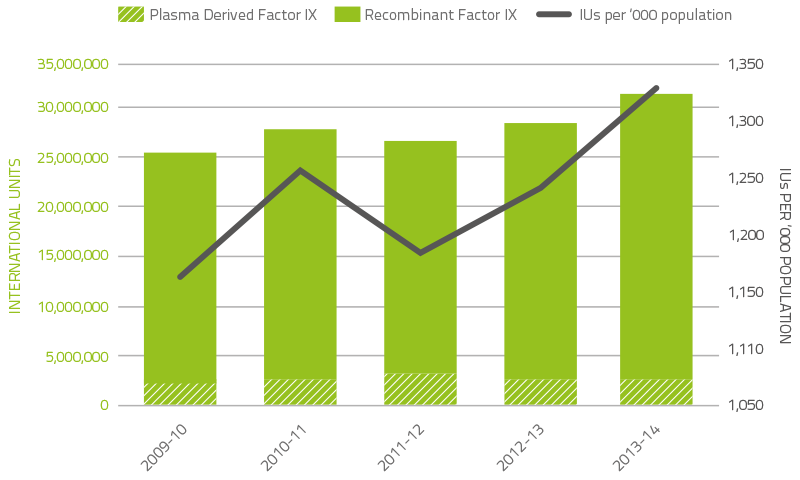
FIGURE 2.6 Issues of Factor IX products, 2008–09 to 2012–13
The demand for rFVIIa and factor VIII inhibitor bypass agent (FEIBA) may vary significantly from year to year as a result of the impact of a small number of patients experiencing very high needs from time to time. Figures 2.7 and 2.8 depict demand for the last five years. The 2013-14 level of demand for rFVIIa returned to the level of previous years and was 21 per cent lower than the unexpected demand in 2012-13. A major influence of the unusual 2012-13 demand was a higher than usual number of acquired haemophilia A patients requiring treatment. FEIBA demand increased with demand in 2013-14 exhibiting a 33.6 per cent increase compared to 2012-13.
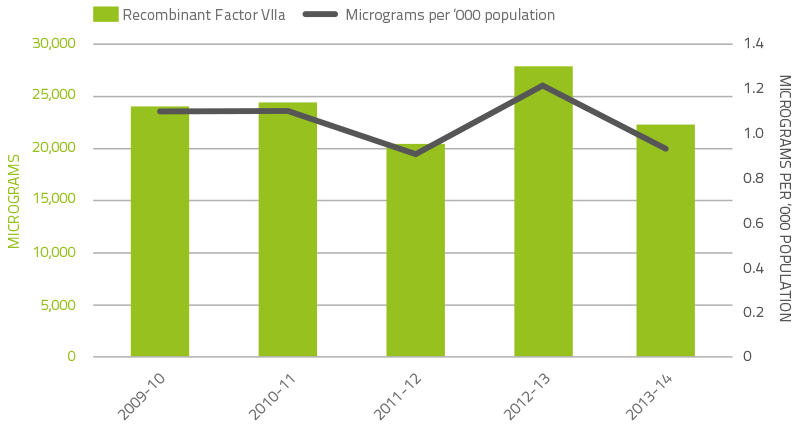
FIGURE 2.7 Issues of recombinant Factor VIIa products, 2009–10 to 2013–14
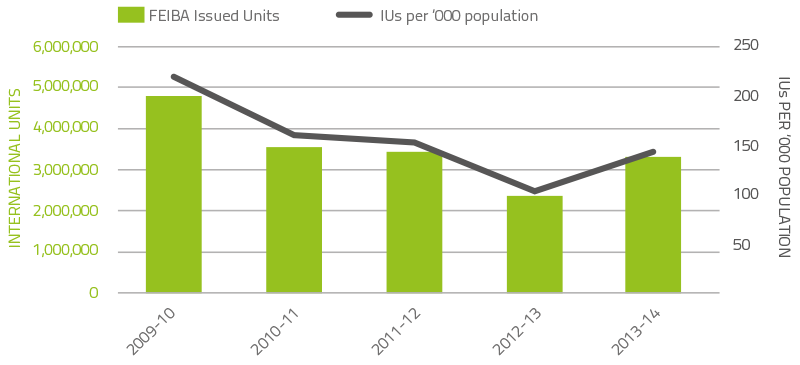
FIGURE 2.8 Issues of FEIBA, 2009–10 to 2013–14
Issues of immunoglobulin: IVIg and NIg
Figure 2.9 indicates that growth in demand for intravenous immunoglobulin (IVIg) has continued at around 11 per cent since 2007-08. However this demand has slowed marginally in recent years. The table below shows the year-on-year demand growth for this product.
| 2009-10 | 2010-11 | 2011-12 | 2012-13 | 2013-14 |
|---|---|---|---|---|
| 11.6% | 11.1% | 10.9% | 10.7% | 11.0% |
In 2013–14, a total of 4.02 million grams of IVIg was issued, representing a cost of $244 million nationally (excluding cost of plasma collections). Of this, 67.7 per cent was IVIg produced in Australia and 32.3 per cent was imported. Excluding IVIg issued under direct orders, a total of 13,981 (compared with 13,102 in 2012-13) patients nationally were issued IVIg during 122,791 treatment episodes (110,183 in 2012-13).
An analysis of IVIg use indicates that there are still considerable variations in the grams issued per treatment episode across jurisdictions for some conditions. Neurology remains the discipline using the greatest amount of IVIg and demand is still increasing. Haematology is the next largest user of IVIg but growth has slowed within this discipline. A similar decline in growth has been observed in immunology, the third largest user of IVIg. The top three indications for which IVIg is issued most frequently are chronic inflammatory demyelinating polyneuropathy, common variable immunodeficiency disease and myasthenia gravis.
The NBA produced an annual report of IVIg usage in 2013–14, in order to document the trends in the use of IVIg and provide insights into the drivers of use at the micro level.
The Report on the Issue and Use of IVIg 2012-13 can be found on the NBA website at http://www.blood.gov.au/data-analysis-reporting.
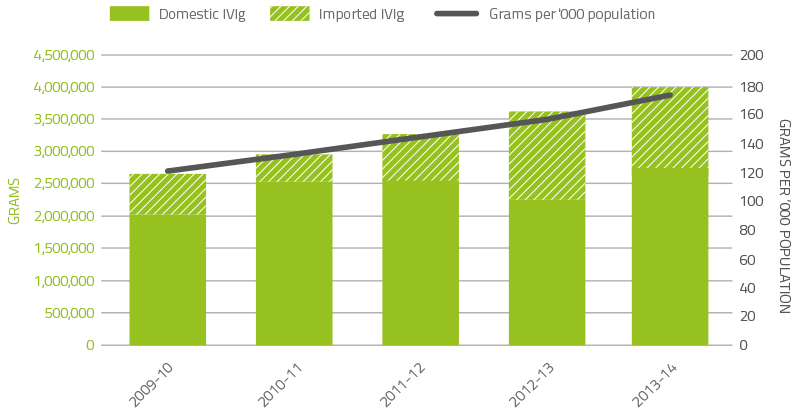
FIGURE 2.9 Issues of IVIg products, 2009-10 to 2013-14
Subcutaneous immunoglobulin
On 1 March 2013, the Jurisdictional Blood Committee (JBC) approved the introduction of subcutaneous immunoglobulin (SCIg) under the national blood arrangements through an assurance framework for the appropriate use of the product; product started distribution in September 2013.
The NBA has established arrangements for supply of the following SCIg products:
- Evogam 16% vial size 0.8g/5ml and 3.2g/20ml supplied by CSL Behring (Australia) Pty Ltd (domestic)
- Gammanorm 16% 1650mg/10ml and 3300mg/20ml supplied by Octapharma Australia Pty Ltd (imported)
- Kiovig 10% 1g/10ml, 2.5g/25ml, 5gm/50ml, 10g/100ml and 20g/200ml supplied by Baxter Healthcare (imported)
These products are authorised and distributed by the Blood Service in the same manner as IVIg. Since September 2013, 13,184 grams of SCIg have been issued.
Normal immunoglobulin
As shown in Figure 2.10, demand for normal immunoglobulin (NIg) increased markedly over recent years largely as a result of its use as a subcutaneous alternative to IVIg. In 2013–14, as a result of the introduction of SCIg as discussed above, demand for NIg reduced significantly by 18.8 per cent. CSL Behring (Australia) Pty Ltd produces NIg from hyperimmune plasma specially collected by the Blood Service. The volume of product is limited by the availability of this specialised plasma, and by production scheduling arrangements in CSL Behring (Australia) Pty Ltd’s manufacturing facility.
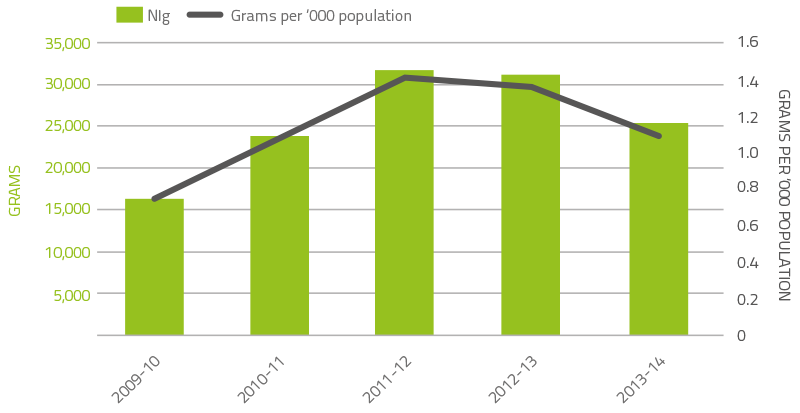
FIGURE 2.10 Issues of NIg, 2009–10 to 2013–14
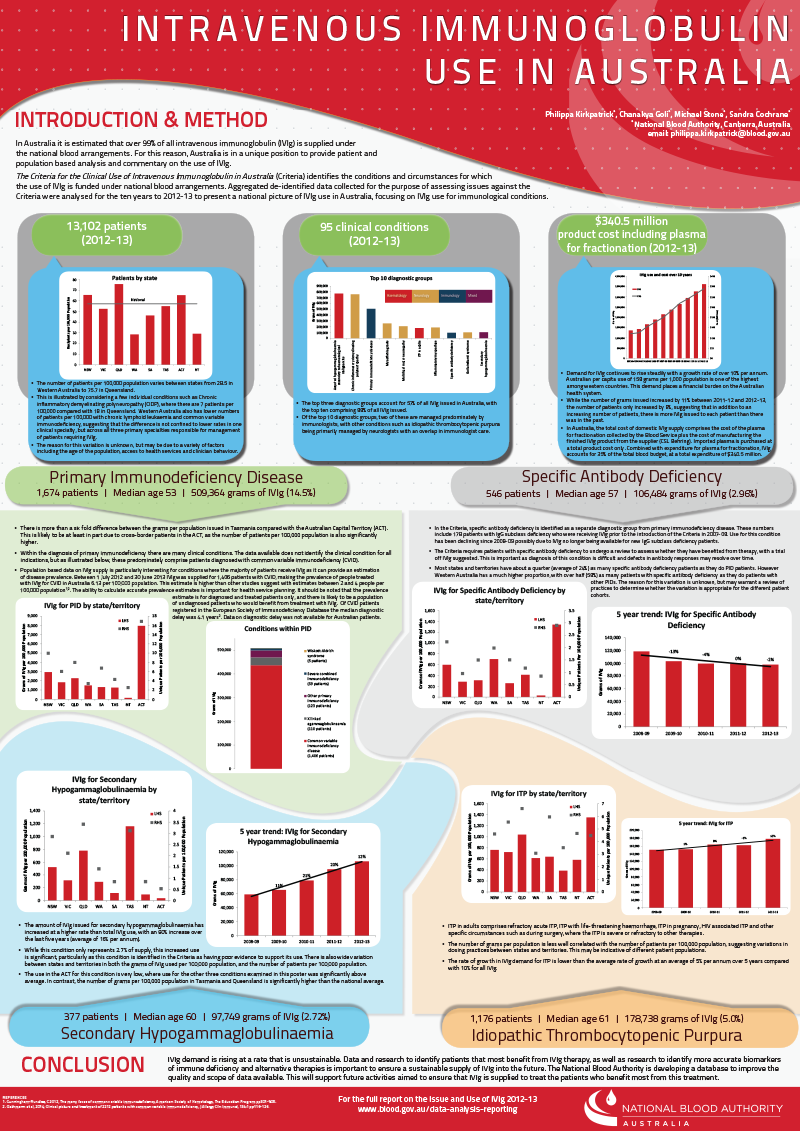
Intravenous Immunoglobulin Use in Australia poster for NBA Conference Presentation
Contract Management
Maintaining security of supply requires the NBA to manage contracts with suppliers of blood and blood products. Contracts are developed in accordance with the Commonwealth Procurement Rules, and managed in accordance with best practice guidance for contract management, including the guideline from the Australian National Audit Office (ANAO) on Developing and Managing Contracts.
In 2013-14 the NBA managed 18 blood and blood product supply contracts and arrangements.
The contracts managed by the NBA included:
- fresh blood product procurement - Australia’s fresh blood component requirements through the Deed of Agreement with the Australian Red Cross Society
- plasma and recombinant product procurement - Australia’s plasma product and recombinant product requirements through:
- the CSL Australian Fractionation Agreement (CAFA)
- contracts for the provision of imported IVIg, imported recombinant factors VIIa, VIII, IX, and XIII, and other imported plasma and recombinant products
- red cell diagnostic reagents product procurement.
Deed of Agreement with the Red Cross
The Deed of Agreement with the Red Cross for the supply of fresh blood products by the Blood Service is one of the most important contracts managed by the NBA. The Blood Service is the sole supplier of fresh blood products. The provision of fresh blood products under the Deed is an essential clinical service that saves lives every day. The NBA has an ongoing programme with the Blood Service to improve contract performance and accountability under the Deed.
Funding provided to the Blood Service is based on an output based funding model (OBFM) arrangement. Funding provided to the Blood Service through the Deed was $583.1 million in 2013–14, an increase of $34 million over the $549.3 million provided in 2012–13.
Performance
The performance of the Blood Service is a key element in meeting blood sector objectives. Governments expect the Blood Service to deliver effective services at optimum value for money. Governments outline their expectations of the Blood Service in relation to performance through the Deed of Agreement and the Blood Service Statement of Expectations. Blood Service performance against selected indicators is outlined in Table 2.4.
TABLE 2.4 Blood Service: selected key performance indicators, 2013-14
| Domain | Indicator | 2012-13 result* | 2013-14 Blood Service target | 2013-14 result* | |
|---|---|---|---|---|---|
| Donor management | First time donors | Whole Blood | 115,188 | 122,343 | 122,343 |
| Apheresis Plasma | 33,070 | 29,714 | 30,327 | ||
| Supply chain management | Number of days within inventory bands (note: bands set by the Blood Service) | 254 | N/A | 315 | |
| Red cell yield (proportion of collections covered to supply) | 89.3% | 87% | 89.5% | ||
| Age of red cells at issue (days) | 9.0 | 9.0 | 8.31 | ||
| Order fulfilment | 95% | 95% | 98% | ||
| Quality and level of service | Health provider satisfaction with Blood Service (mean score out of 10) | 8.6 | 8.7 | 8.7 | |
| Finance | Main operating programme financial result | $12.5 million surplus | >0 | $44.9 million surplus | |
* As measured by the Blood Service.
Implementing improvements to current arrangements
The NBA worked with the Blood Service to deliver a range of contract improvements in 2013-14, including the following:
- implementation of the negotiated second cycle of the OBFM, which defines the products and services to be delivered under the contractual arrangements and product prices to be paid to the Blood Service
- development and agreement to Phase 1 of the National Service Requirements and Standards that will set out the Blood Service’s relationships with health providers and the NBA. This includes business rules and standards for ordering, delivery, and receipt of products
- completion of the National Inventory Management Framework project for red blood cells, including proof of concept and pilots
- extension of the current Deed by mutual agreement until 30 June 2015.
Blood Service research and development
The NBA and the Blood Service implemented an agreed research and development framework in 2013-14 as part of the Deed of Agreement variation. This framework outlines strategies to ensure appropriate incorporation of government priorities and expectations in the development and implementation of the Blood Service research programme. It also describes reporting requirements that will improve the transparency to governments of activities and expenditure under the research and development programme.
Through a grant specified in the Deed of Agreement, the Blood Service received grant funding of approximately $8.3 million for its research and development programme. The Blood Service has four research programmes:
- donor and community
- applied and developmental
- transfusion science
- clinical.
Research projects in 2013-14 included work on the development of frozen blood products. The Hon Stuart Robert MP, Assistant Minister for Defence attended a capability display in May 2014. The Blood Service also conducted research on the extension of the shelf-life of platelets from five days to seven days.
CSL Australian Fractionation Agreement
Most plasma derived products used in Australia are manufactured by CSL Behring (Australia) Pty Ltd under the CSL Australian Fractionation Agreement (CAFA) from plasma collected by the Blood Service. CSL Behring (Australia) Pty Ltd is the sole manufacturer of plasma derived blood products in Australia and the NBA is responsible for negotiating and managing the CAFA.
In 2013-14, 545.1 tonnes of Australian plasma was pooled for fractionation under the CAFA, and expenditure on CAFA products was $205.2 million.
Performance
The 2013-14 performance by CSL Behring (Australia) Pty Ltd against the CAFA Key Performance Indicators (KPIs) is shown in Table 2.5. This table reports actual performance. Sufficient supply of all products was maintained at all times. CSL Behring (Australia) Pty Ltd’s performance was within defined tolerances for each of the KPIs with a few minor exceptions. Some approvals for KPI deviations were given by the NBA where known issues were beyond the control of CSL Behring (Australia) Pty Ltd, including changes in the level of immunoglobulin in plasma, and the dynamics of supply, demand and production for some products, which affected CSL Behring (Australia) Pty Ltd’s ability to meet KPI standards.
TABLE 2.5 CSL Behring (Australia) Pty Ltd’s performance under the CAFA, 2013-14
| Description of performance measure | Results 2013-14 | |||||
|---|---|---|---|---|---|---|
| Q1 | Q2 | Q3 | Q4 | Annual | ||
| KPI1 | Plasma stewardship | Achieved | Achieved | Achieved | Achieved | Achieved |
| KPI2* | Production yield | 4.98g/kg | 5.12g/kg | 4.91g/kg | 4.82g/kg | 4.96g/kg |
| KPI3 | Management of required inventory levels | |||||
| Minimum starting plasma inventory | Not active in 2013-14 | |||||
Products in CSL Behring (Australia) Pty Ltd Inventory |
100% Achieved | 100% Achieved | 97% Achieved | 96% Achieved | 98% Achieved | |
| Products in national CSL Behring (Australia) Pty Ltd reserve | 100% Achieved | 100% Achieved | 76% Achieved | 100% Achieved | 94% Achieved | |
| KPI4 | Fulfilment of orders | |||||
| Orders by distributor (Blood Service) | 100% Achieved | 99% Achieved | 100% Achieved | 99% Achieved | 100% Achieved | |
| Orders by non-distributor | 99% Achieved | 99% Achieved | 100% Achieved | 98% Achieved | 99% Achieved | |
| KPI5** | Shelf life of national reserve products | 82% Substantially Achieved | 86% Substantially Achieved | 100% Achieved | 98% Achieved | 92% Achieved |
Note:
* The NBA and CSL Behring (Australia) Pty Ltd are considering the effects of changes in plasma collection practices on CAFA contractual provisions
relating to IVIg yield
** The NBA has agreed that, as an interim measure, the minimum required shelf life of some hyperimmune products held in the National CSL Reserve is reduced to avoid surplus production. CSL Behring (Australia) Pty Ltd ‘s Performance is substantially in line with this agreement.
Mid-Term Review
During 2013-14 the NBA conducted a mid-term review of the CAFA to confirm the agreement met governments’ requirements in terms of value for money and performance. The Review Report concluded that:
- CSL Behring (Australia) Pty Ltd has satisfactorily performed its obligations under the CAFA
- the CAFA meets value for money expectations
- the CAFA provides a range of products that are generally equivalent to international products, and with a competitive yield for the leading product IVIg.
Imported intravenous immunoglobulin
IVIg is imported to meet a shortfall in domestic IVIg production against clinical demand in Australia. In addition to supply under the national blood arrangements, the NBA also supports the purchasing of small amounts of imported IVIg using jurisdictional direct orders.
Two contracts are in place for supply of imported IVIg under the national blood arrangements. The contracts commenced on 1 January 2012 for a period of three years and have provision for a one year extension. The suppliers are Baxter Healthcare Pty Ltd and Octapharma Australia Pty Ltd. In 2013-14, the NBA spent $75.69 million for both contracts.
Performance
The 2013-14 performance of both suppliers against the contractual KPIs is shown in Table 2.6. Sufficient supply of products was maintained at all times in accordance with contractual requirements and was not affected by transient or administrative KPI deviations.
TABLE 2.6 Imported IVIg: Key performance indicators, by supplier, 2013-14
| KPI | Performance | Octapharma Australia | Baxter Healthcare |
|---|---|---|---|
| KPI1 | In-country reserve | Substantially achieved | Substantially achieved |
| KPI2 | Shelf life on products delivered | Substantially achieved | Substantially achieved |
| KPI3 | Delivery performance | Fully achieved | Fully achieved |
| KPI4 | Reporting accuracy and timeliness | Substantially achieved | Substantially achieved |
Note: "Substantially achieved" denotes the contractor achieved 90 per cent or above of the contract requirements during 2013-14, but did not fully meet the contractual performance target(s).
Imported plasma derived and recombinant blood products
The NBA has contracts with suppliers for the importation of selected plasma derived and recombinant blood products to augment domestic supply where these products are not produced in Australia or domestic production cannot meet demand.
In 2013-14, the NBA managed the supply contracts for imported plasma and recombinant products with the following five companies:
- Bayer Australia Ltd
- Baxter Healthcare Pty Ltd
- CSL Behring (Australia) Pty Ltd
- Novo Nordisk Pharmaceuticals
- Pfizer Australia Pty Ltd
The supply contracts for the above suppliers expired on 30 June 2014. The NBA has exercised the option for a one year extension for the supply of Protein C, Activated Prothrombin Complex Concentrate, recombinant factor XIII, anti-Rh (D) and NovoSeven RT. Expenditure on the contracts during 2013-14 was $165.6 million.
In 2013-14, the NBA successfully concluded a tender process for new contracts for the national supply of recombinant Factor VIII and IX products which will commence on 1 July 2014. The new contracts were awarded to Baxter Healthcare Pty Ltd and Pfizer Australia Pty Ltd and are projected to achieve annual savings in the order of $50 million per year.
Performance
The 2013-14 performance of suppliers of imported plasma and recombinant blood products for each performance measure is shown in Table 2.7. All suppliers satisfactorily met required performance levels.
TABLE 2.7 Imported plasma and recombinant blood products: key performance indicators, by supplier, 2013-14
| KPI | Performance Measure | Baxter Healthcare | Bayer Australia | CSL Behring (Australia) Pty Ltd | Novo Nordisk Pharmaceuticals | Pfizer Australia |
|---|---|---|---|---|---|---|
| KPI1 | In-country reserve | Fully achieved | Partially achieved** | Fully achieved | Fully achieved | Fully achieved |
| KPI2 | Shelf life on products delivered | Fully achieved | Achieved* | Fully achieved | Fully achieved | Fully achieved |
| KPI3 | Delivery performance | Partially achieved** | Achieved* | Fully achieved | Fully achieved | Achieved* |
| KPI4 | Reporting accuracy and timeliness | Achieved* | Achieved* | Fully achieved | Achieved* | Fully achieved |
*In these instances, the performance of the relevant supplier departed from the contracted requirement at some periods during the year, but without material effect on supply performance or supply security. Such instances are managed through prior approvals from the NBA, and discussion of supplier performance during the year.
** In these instances, the performance of the relevant supplier departed from the contracted requirement at some periods during the year. Performance of the relevant suppliers was nonetheless subject to contractual requirements and was managed through ongoing contract management monitoring. Where appropriate, financial consequences of not meeting contractual Key Performance Indicators were applied.
Red cell diagnostic reagent products
Red cell diagnostic reagents are used for testing to establish the blood group of human red cells, detect red cell antibodies and to control, standardise and validate routine haematology tests.
The NBA has established a standing offer arrangement with the following five suppliers for the period 1 July 2011 to 30 June 2015:
- Abacus ALS Pty Ltd
- Bio-RAD Laboratories Pty Ltd
- CSL Behring (Australia) Pty Ltd
- Grifols Australia
- Ortho-Clinical Diagnostics (Johnson & Johnson Medical Pty Ltd)
The standing offer lists more than 130 red cell diagnostic products, which are used in laboratory tests known as blood typing and cross matching. These tests ensure that when a person needs a blood transfusion, they receive blood that is compatible with their own.
Expenditure on diagnostic reagent supply is capped at $4.8 million per year. The NBA manages the cap for all jurisdictions and suppliers.